Here’s a little something for you stats junkies.
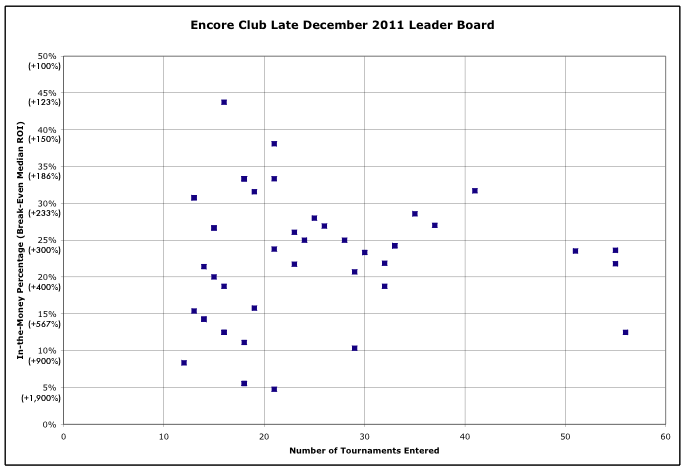
This data’s taken from the Encore Club’s posting of point leaders near the end of last month. Yes, I took a grainy snapshot of the top sheet when I was working on my post about median ROI and ITM the other day, then coded the basic number of tournaments entered and xash (or “place”) information into an Excel spreadsheet. This is what you get:
The point leader sheet doesn’t have any info about dollar values of cashes or field sizes (it does give the number of times the player made positions 1-5), so there’s no ROI calculation, but I’ve added the break-even median ROI for each ITM value on the vertical axis, just for reference.
So here it is. 46 live game players from a single venue in town over most of a month. The median number of games played is 21. The median number of games in the money is 6. The median cash percentage is 24% (yes, that’s different from the games ITM/games played; that’s statistics for you). The sample size is relatively small in terms of games played, but you can see a definite progression downward to the mean as the number of games increases.

