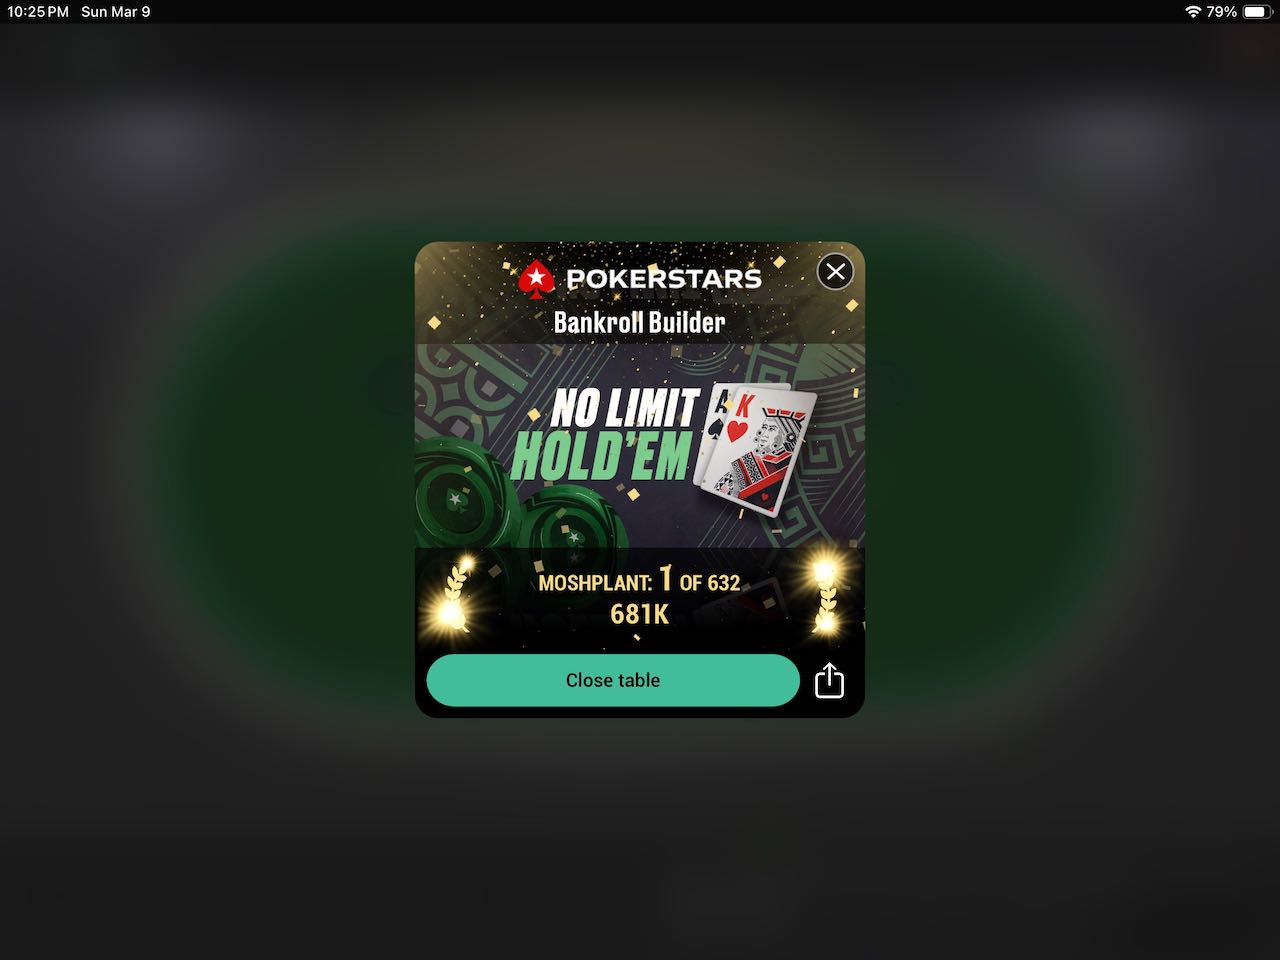
I played another Beaverton Quarantine NLHE Bounty for last place the week after I got back, then some Chainsaw Poker PLO/8 6-Max and 8-Game tournaments. All told, 11 tournaments (including Vegas) and $0 in cashes. 21 hours of poker for the month, which seems rather meagre, given that the World Series of Poker Main Event has just wrapped up the last of the Day 1s without me yet again.
Forgot to mention yesterday that I saw Martin Kabrheltwice! between the time I got to the Paris and the time I got registered for the Big O Satellite. If you see him three times in five minutes, it means bad luck.
Orleans Summer Open $100K Guaranteed NLHE Seniors
Got up bright and early to get ready for this one. Since I was a late arrival to poker (at least in my current incarnation), I’ve been playing seniors tournaments as long as I’ve been coming to Vegas for poker. My first Hendon Mob entry is from a Seniors tournament at Caesars.
Maybe I did see Kabrhel three times, because somehow despite having kings three times and flopping quad sevens once, I never managed to get over the starting stack in more than three hours of play.
I was seated across from Bill Stabler, whom I’d never met but whose name I was familiar with, as he’d been a feature of various write-ups here over the years, including where he’d finished second in the WSOP Seniors event. Bill mentioned that he’d driven up to the Orleans with someone who pointed me out from behind and referred to me as “Simpsons”, presumably because my card cover is modeled on an accessory to a Professor Frink figurine.
Bill busted out, I made a bit of a recovery from 1/4 starting stack, ran what may have been an unknowing bluff, then immediately blew it all with a nut flush draw vs. a set of kings.
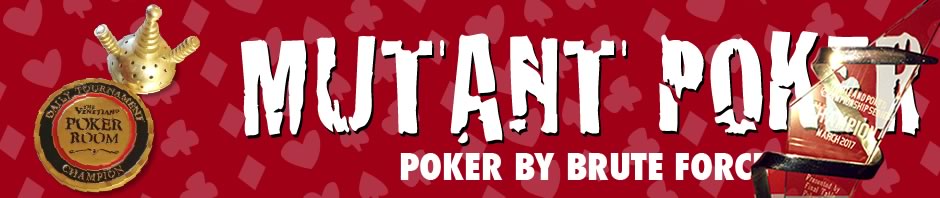
Something that was on my radar was the WSOP Online #9 PLO PKO 6-Max bracelet event at 3:30pm, which had a satellite at 1pm. But I could not get the WSOP NV app to run. Issues with the servers? There was no indication what the problem was. I didn’t want to schlep over to Paris/Horseshoe just to find out there was a systemic problem, but it did occur to me that there might be an issue with other players in close proximity, which I know Caesars exempts for their own properties but maybe not Boyd?
I got a sandwich and planned my next move. Which ended up being re-entry into the Seniors tournament. I signed up just before a break and found myself at a table two seats from Bill again, only this time he had a stack that must have been over five times the starting stack.
Again, things just didn’t go well, and I was out in about 90 minutes when I shoved J♣T♣ and was called by ace-rag from a big stack who caught an ace on the flop. Didn’t even make the end of registration.
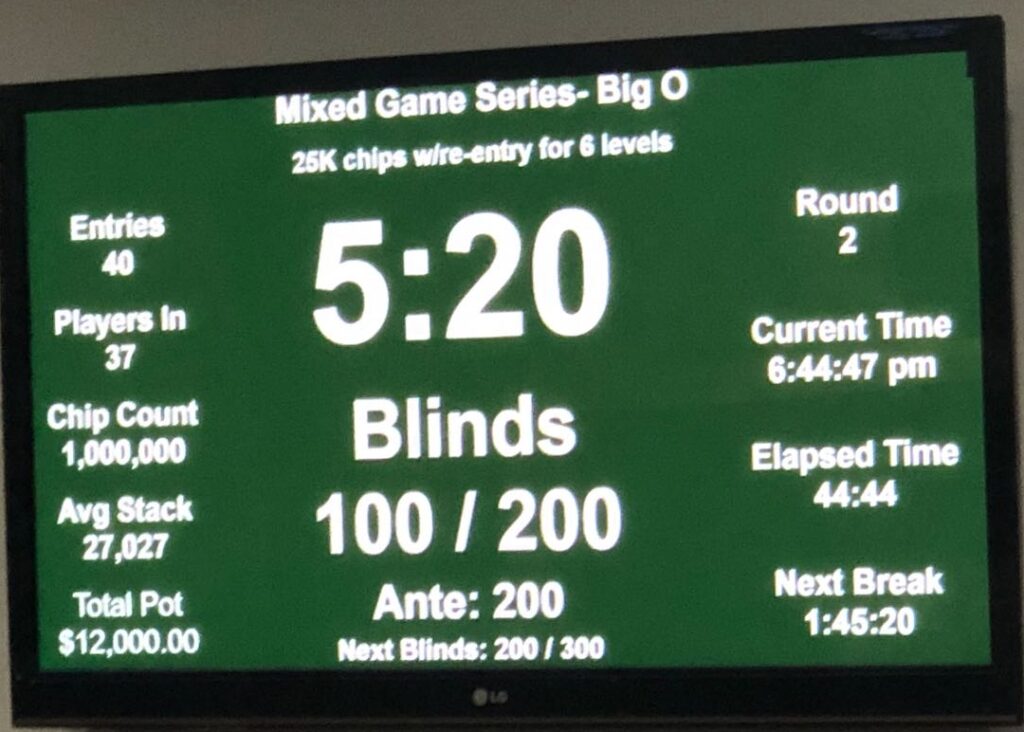
Orleans Summer Open $10K Guaranteed Big O
There were only about 20 minutes before the start of the Big O, so I signed up for that. Things were going on reasonably well. I watched a hand where a player potted on a KxKx6x flop and was re-potted. She folded, showing a pair of sixes and her opponent showed he just had trip kings, which led to some self-recrimination. Not long after, I flopped a set of jacks on a QxJx7x board and pushed hard on the flop. On the 5x turn, I was all-in and she called for less, making an 8-high straight and low on the river, leaving me with about 10bb.
I did manage to run that up to about half a starting stack before the end of things. I headed back to the Rio.
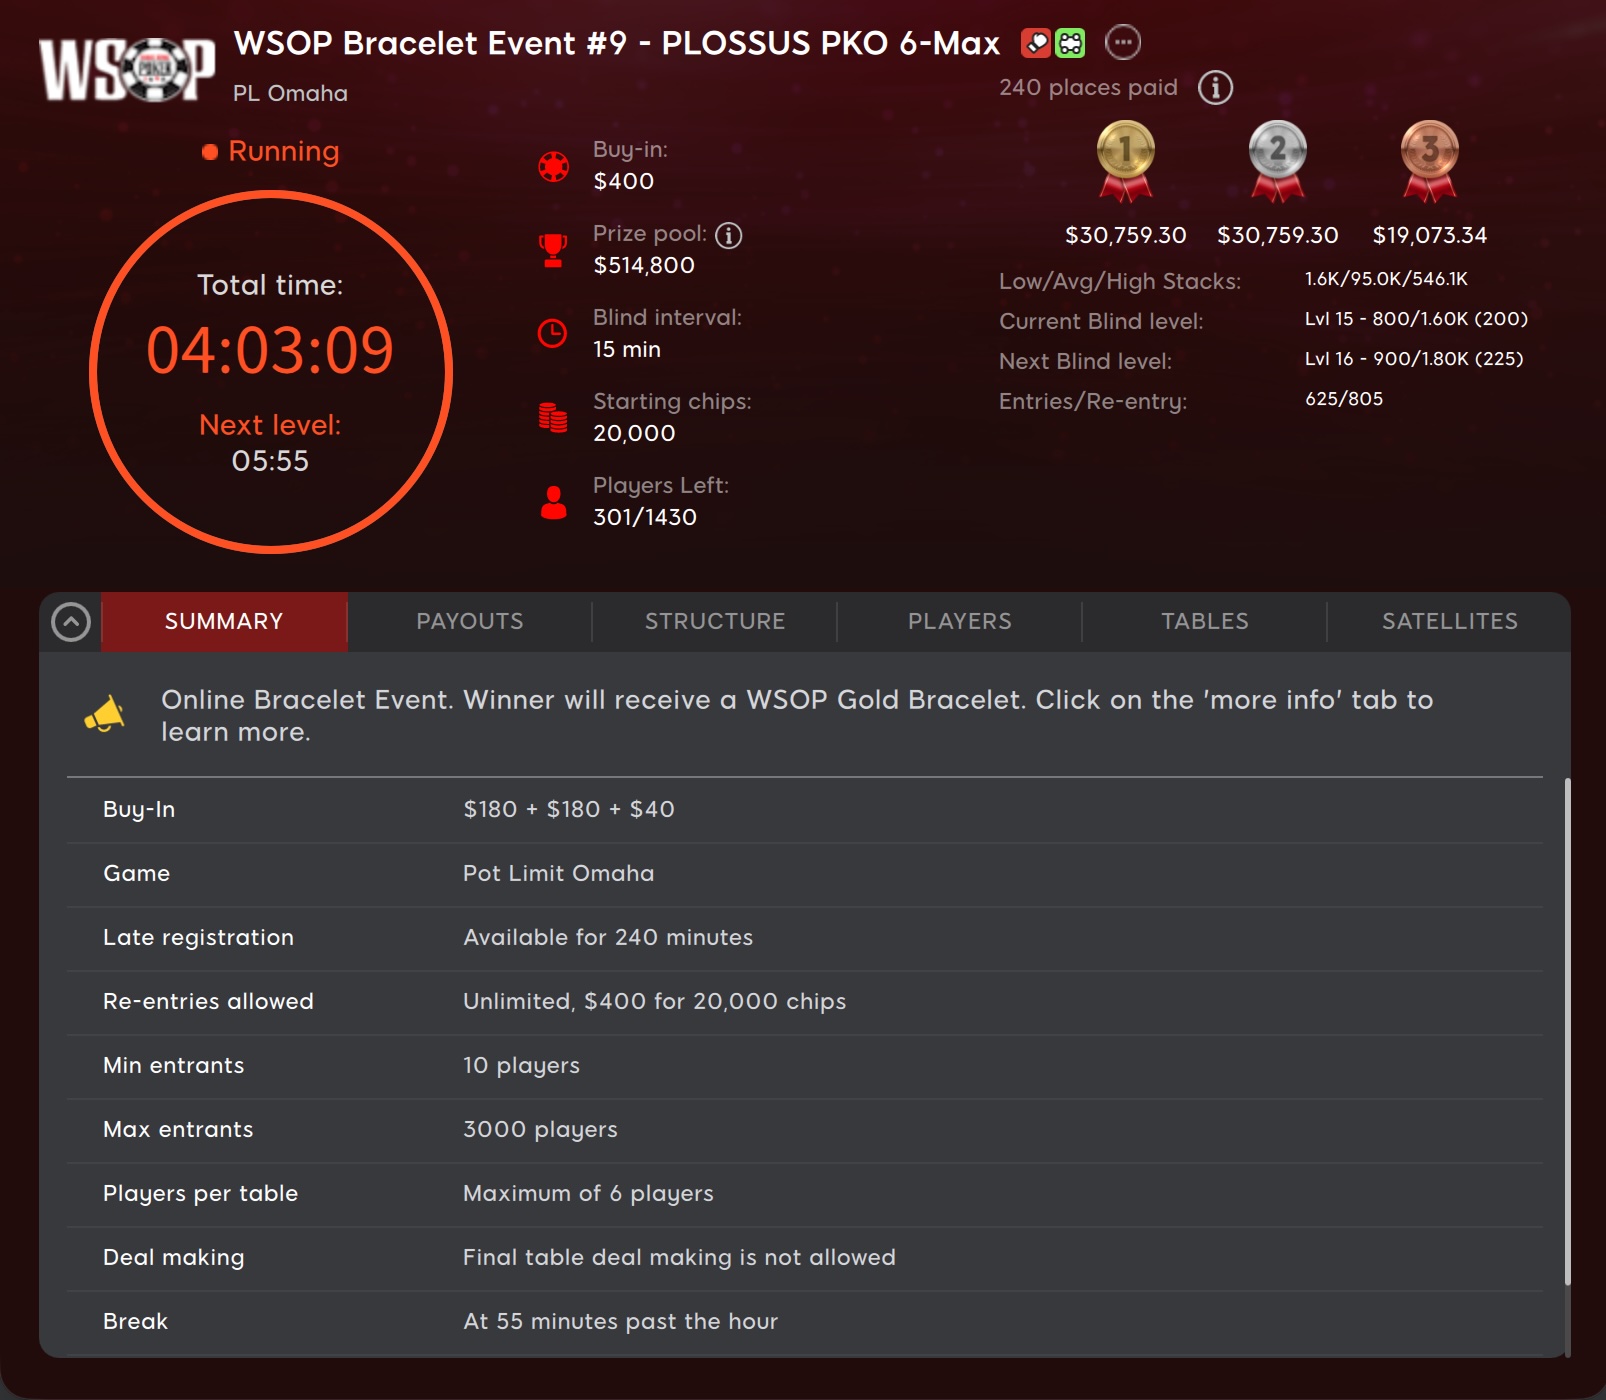
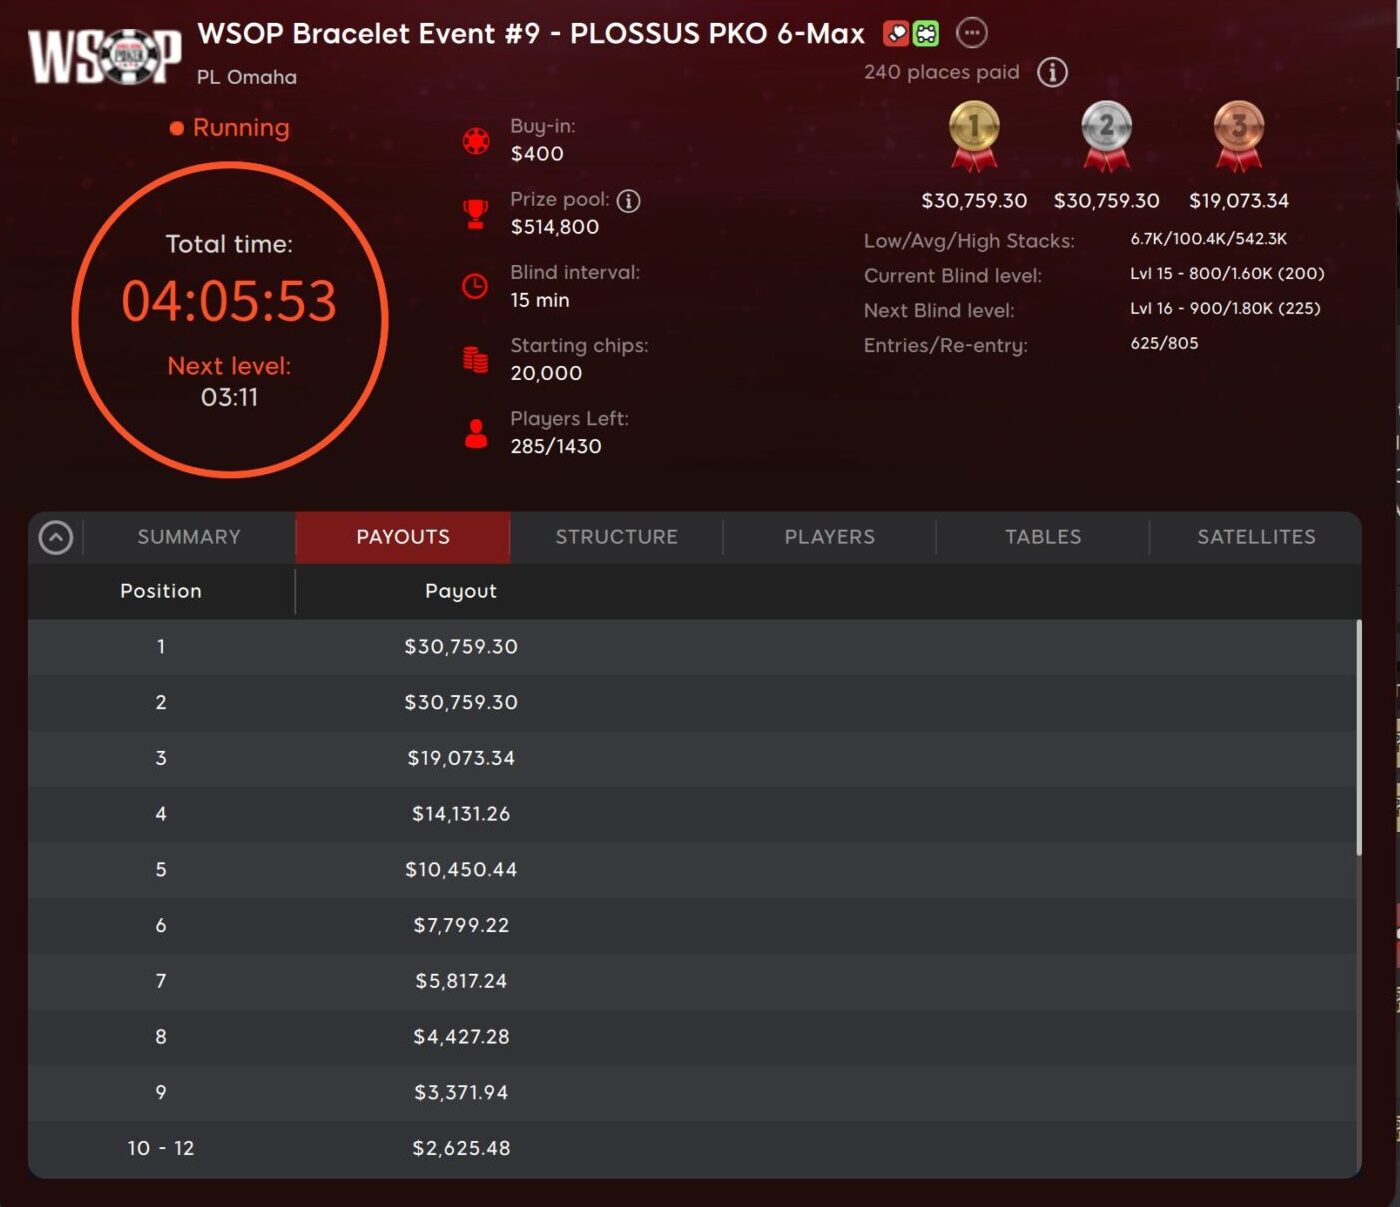
WSOP.com #9 PLOSSUS PKO 6-Max
When I got back to my room, I checked in on the status of WSOP NV, and, indeed, the app was running just fine, so my guess about why things weren’t working at Orleans appeared to be right. Fortunately, I was able to use my debit card to add some money to my account and jump right in, though perhaps that’s not the best thing to do when the average stack is already double starting stack in a PKO. My table had one player with a 4x stack, and in the half-hour I was in the tournament, players were dropping like flies. Eventually, I fell, as well. Fun format, though.
And that was it for the day. I made calls back home, got a chocolate shake, and came back to the room just in time to catch the last 30-seconds of fireworks over New York New York celebrating the Knicks championship win.
We’re in the run-up to another Poker Summer Camp in Las Vegas. It was 10 years ago when I worked at the World Series of Poker as a live reporter. Fifteen years since my first time playing in Vegas. I haven’t been there every summer, and skipped several years since working there entirely. Missed last year, and it’s going to be a stretch to find the time to get down this summer, even after a couple of decent cashes this spring. At least my most recent game there was a win! I’ve got some ideas…
Online
My Chainsaw experience continues to be mostly negative. Not because I’m not enjoying it, but because the player field includes a lot of people who are actually good at mixed games. I thought I was—and around Portland that may have been true at one point—but throw me in the water with people who’ve won bracelets and maybe not.
I stepped up the pace a bit this month after the cash in April’s PKO. 20 tournaments, which started off with a nice second place in a Limit Hold’em. Then it was 19 more tournaments (Pot Limit Omaha, 7-Card Stud, Pot Limit Omaha Hi-Lo (2), 7-Card Stud Hi- Lo (2), 8-Game Mix (5), 5-Card Pot Limit Omaha, HORSE (3), Limit Omaha, more Limit Hold’em (2), Limit Omaha Hi-Lo) with only a single cash from a small LHE game and four stone bubbles. That was painful.
Because I was stepping up my non-home game play this month, I only participated in one of the Beaverton Quarantine games, placing in the middle of a single-table PLO Bounty tournament.
Live
My former work colleague Ben—who’s made a couple of trips to Las Vegas with me—is back in Portland and wanted to get together to play a little poker. We headed to Milwaukie’s Stadiums Sports Bar, the remaining outpost of the One Good Hand Oregon Poker Club for their Friday night $50 No Limit Hold’em tournament. We had a couple beers before joining in, then I lasted about two-and-a-half hours before busting halfway through the field. Ben made it to 4th place, though!
Portland Meadows Poker Classic
Middle of May was the Portland Meadows Poker Classic.I popped in for Monday’s 5-Seat Guaranteed NLHE Main Event Satellite, pumped in a couple of buy-ins, then missed one of the 9 tickets by three places. I regmaxxed the PLO Double Board Bomb Pot tournament on Tuesday and only lasted 35 minutes but with all of the early rebuys still ended up in the top half of the field.
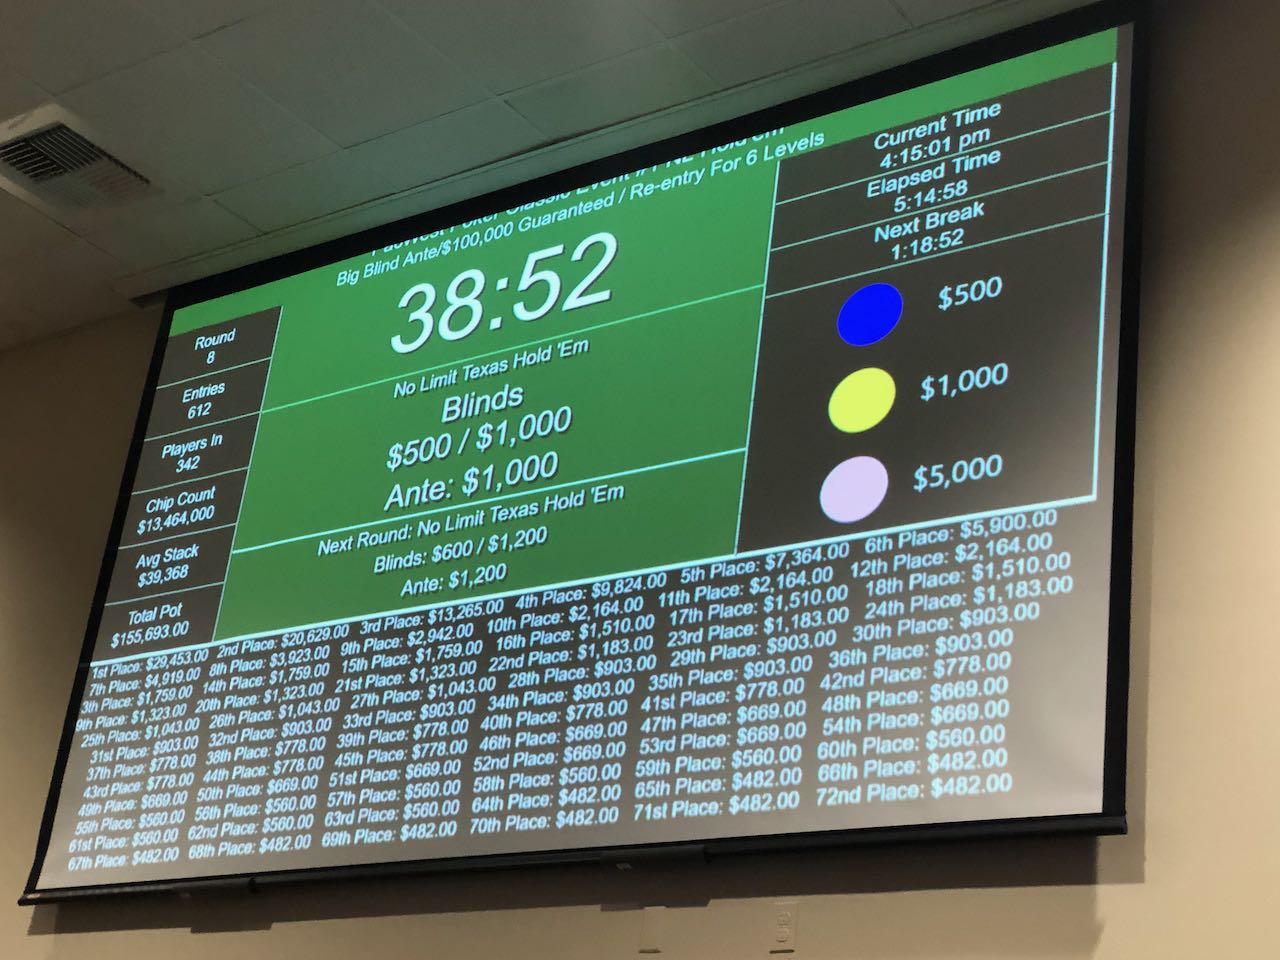
Since I didn’t win a satellite seat, I bought in directly to the series’ $100,000 Guaranteed NLHE Main Event. I’d entered the time into my schedule as noon but realized things had started an hour earlier when Devin Sweet looked at me disapprovingly, so I sat down in the middle of action. Not long after I sat down, owner Brian Sarchi looked up from a conversation and called over that he’d just been talking about not having seen me for a while (we had a nice talk ourselves during a break later) and I’m attributing everything after that to good ju-ju from this incident.
I’d played against one of the table young guns (at this point, almost everyone is a young gun compared to me) before and had noticed how he battered at early betting pre flop with massive raises, so when I called a small opening raise with 5x5x and he raised to 10x, once the original raiser had folded, I made the call. The flop came 4x4x2x, there was a chunky c-bet, then it went check- check on the 3x turn and 2x river. He showed AxKx, my fives took the hand and he seemed a little annoyed, but that might just be me.
A couple of hands later, he opened from seat 8 with a normal raise, got called, then the player who’d opened in the previous hand (seat 2) 3-bet, the young gun 4-bet, and the guy who’d called him (seat 9) shoved all-in. Seat 2 re-shoved, and all three players got it in pre-flop with kings (seat 2) vs. tens (seat 8) vs. jacks (seat 9). The flop was Tx8x8x, and it’s luck like that you need to have to win.
A couple hours after I registered, I was moved to one of the upstairs tables. I’d never been upstairs at the club—it’s not usually opened up to the public—but people came from all over the Pacific Northwest for this tournament, which promised to have one of the largest prize pools in region for the year (hey, it’s why I was there!). With only three casino venues in Oregon and Washington running tournament series these days, there are just a handful of events per year this big. Anyway, the upstairs is everything you might have been expecting—and more! Seriously, though, I did hear a couple of people saying they missed the hubbub of voices and clatter of chips in the first floor space where there were more than 20 tables.
By the end of hour four, the prize pool was more than double the guarantee, and there was still half an hour of registration. After a couple levels of stagnation, I was slowly starting to climb, especially after getting someone to call an overbet on the river when I held ac7c and there were four clubs on the board. I was up to three times the starting stack (about 150% of the average) at six-and-a-half hours in, with more than half the field gone
Our table upstairs broke at the seven-hour mark. Got aces in the small blind and squeezed over a raise fromTam Nguyen and a call. Showed it to establish a little table cred. Then I lost a significant chunk drawing against him when it was a big blind defend I should have just tossed.
Beat down another Tam open with queens in the small blind, then AxKx on the button against the table chip leader who called my 3-bet got me back up to 200k.
Blind vs. blind, I open-called Kx8x from the small blind. The big blind raised to just over three big blinds, and I came along to see a Jx7x4x flop. We check, and it’s 8x on the turn. I bet about 3bb, he called, and a Kx on the river gave me two pair. I opened with a bet of 6bb, he quickly called and shows 8x4x, then says “Wow”. Will it stop him from raising that hand on the big blind again? I doubt it.
Halfway through the ninth hour of the tournament, we’re down to 72 players, with half of the remaining field getting paid.
A player from out-of-town who’d been at my upstairs table with a lot of chips had had some things happen since I’d last seen him, and he shoved his short stack after seeing a A♥Q♥6x flop. one of the big stacks at the table made a large re-raise, and the biggest stack shoves, with the other big stack calling all-in. The biggest stack has a set of sixes, the other large stack has K♥J♥ for both Broadway and nut flush draws. It’s a Tx on the turn, and more than half a million chips transfer between the players, making what I think is one of the first million-chip stacks in the tournament.
My caution gets the best of me sometimes. A player on my right shoved for almost all of my chips, I fold8x8xwith four to act behind me, including the monster stack, who calls. AxTx for the all-in player, TxTx for the big stack, flop of AxJx8x, and I missed a chance to triple up, but it was the right play.
Opened J♣9♣ and got a couple of callers with a flop of K♣Q♣Qx that got checked through to a T♦ turn and even better 6♣ river (though the T♣ would have been nice). For comparison to the big stack, that got me to 345k. Oh, and I got aces next hand.
By the time we were hand-for-hand a little more than eleven hours into the tournament, I was just below the 25bb chip average. Hand-for-hand lasted about 40 minutes, I was under 20bb by the time we got there. I managed to double up in the next half hour AxQx vs. KxJx to 27bb.
At the 13-hour point, I picked up KxKx and shoved my sub-average stack, managing to get called by one of the larger stacks holding TxTx and doubled up to over a million, with 21 players remaining and just about 14M chips in play. Three-quarters of an hour later, we were down to two tables. The pace picked up a little, and we lost six players in 40 minutes.
It was on the final table bubble where I made my big mistake. An active player with a big stack immediately to my right raised and I just called withJxJx when the right thing to do with my average-sized stack was to shove. I started the hand with just over a million in chips, the big blind was 60k, I had less than 20bb, but I was in early position and was cautious of the folks behind. With a 3x3x2x flop, I thought I might be safe, and as the player was fairly aggressive, I just called on the flop and turn, then he put out a bet of almost 10bb on the river and I called that, too, because I had an over pair to the board. As it turned out, he had pocket threes, and I was dead from the flop (well, technically, the turn, but…) Anyway I was out in 10th place a couple hands later shoving less than 10bb and just missing out on the final table photo and the potential of another $40K that went to first place. Congrats to everyone who made it.
Photo from Portland Meadows Poker Club Facebook.
Final Table $10K GTD NLHE (x2)
I haven’t played a lot of the Friday night $10K GTD NLHE tournaments at Final Table Poker Club since I poker-retired (I played 20 of them in 2018), preferring to save my poker hall passes for the First Friday $20K GTD, but since it’s late May, the run-up to the World Series of Poker, I decided to hit the last two weeks.
Friday after the $100K at Meadows, I late-registered about 90 minutes in (roughly a half-hour before the end of reg). ShovedAxKxon my first hand and got a fold from the original raiser (starting stack was around 50bb at that point). Then I lost a big hand to the same player for more than I’d won on my shove. A few hands later, I raise 6♠6♣ and Dave Tragethon in seat 1 limp-calls the raise. The flop is 8♣7♣5♣. The turn is inconsequential, and Dave puts me nearly all-in. I shove my open-ended straight-flush draw, he calls with J♣Tx and gets the better flush with Q♣ on the river. I rebuy (there’s a single live rebuy in this tournament, you can’t leave the table and re-enter).
Blinds are up to 300/600 with a big blind ante. Starting stack is 20K, so I’m starting the second bullet with 33bb. On the button with aces. Dave starts to put out a raise from seat 1 before seat 9 has had a chance to act, then 9 puts out a raise of 2700. Dave calls. I shove my brand-new stack. Seat 9 calls, Dave folds and shows sixes. Seat nine has jacks. The flop is 6x8x9x and Dave would have made the set; the turn: 7x, and, of course, the river is Tx. So my rebuy lasts one hand. At least I’m out before the add-on.
The next Friday, tables are turned for a while as on the fourth hand of the night while we’re still 200bb deep I get it in with queens against aces and flop a queen. I’ve already won a hand, so the other player is covered and does not rebuy.
There was a kind of wild hand at the table that I wasn’t involved in where two player got all-in pre flop with 9♦9♥ vs. A♣A♠. The flop was J♦9♠7♣, flipping the script, but then the turn was A♥, which had everyone wowing and winded by the time the 9♣ landed on the river. It’s stuff like that that makes poker such a great game.
The rest of the tournament’s unremarkable, I call a shove for half my stack and lose a flip, then get cut down to half a starting stack, work my way back up to start, and make it to the end of registration. Got the add-on and after some consideration the re-buy, so I start the next session with slightly fewer chips than I would have if I’d max late-regged and just bought all that I could.
Four hours in, I was down to 10bb and shoved Ax8x from the hijack. The blinds were in an animated World Cup discussion and the small blind says “Call” but just puts out enough chips to call the big blind, who just checks. The dealer points out there’s an all-in and asks if small blind wants the floor after the big blind folds. Small blind looks at my meagre stack and shakes his head, turning over 8x4x. There’s a four on the flop.
For whatever reason, the games I tend to find myself in in the Chainsaw Poker online tournaments tend to be barely more than a single table, but the first week of March, there were a couple that made it into the low 20s for entries. Not that it did me any good, as I was in the bottom half of all five of them: a couple 7-Card Stud Hi-Lo, HORSE, Pot Limit Omaha Hi-Lo, and a smaller 8-Game Mix.
That was followed up by chops in consecutive Beaverton Quarantine games on the same Friday (No Limit Hold’em and ot Limit Omaha Hi-LoBounty. Week 2 of March concluded with another couple of losses on Chainsaw Poker (both 8-Game).
The Home Game went off on its usual Monday but I flamed out in fifth of eight after a couple hours. Then there were three more Chainsaw 8-Games, one of which I min-cashed in (just 73% ROI) and the other two where I was in the bottom half again.
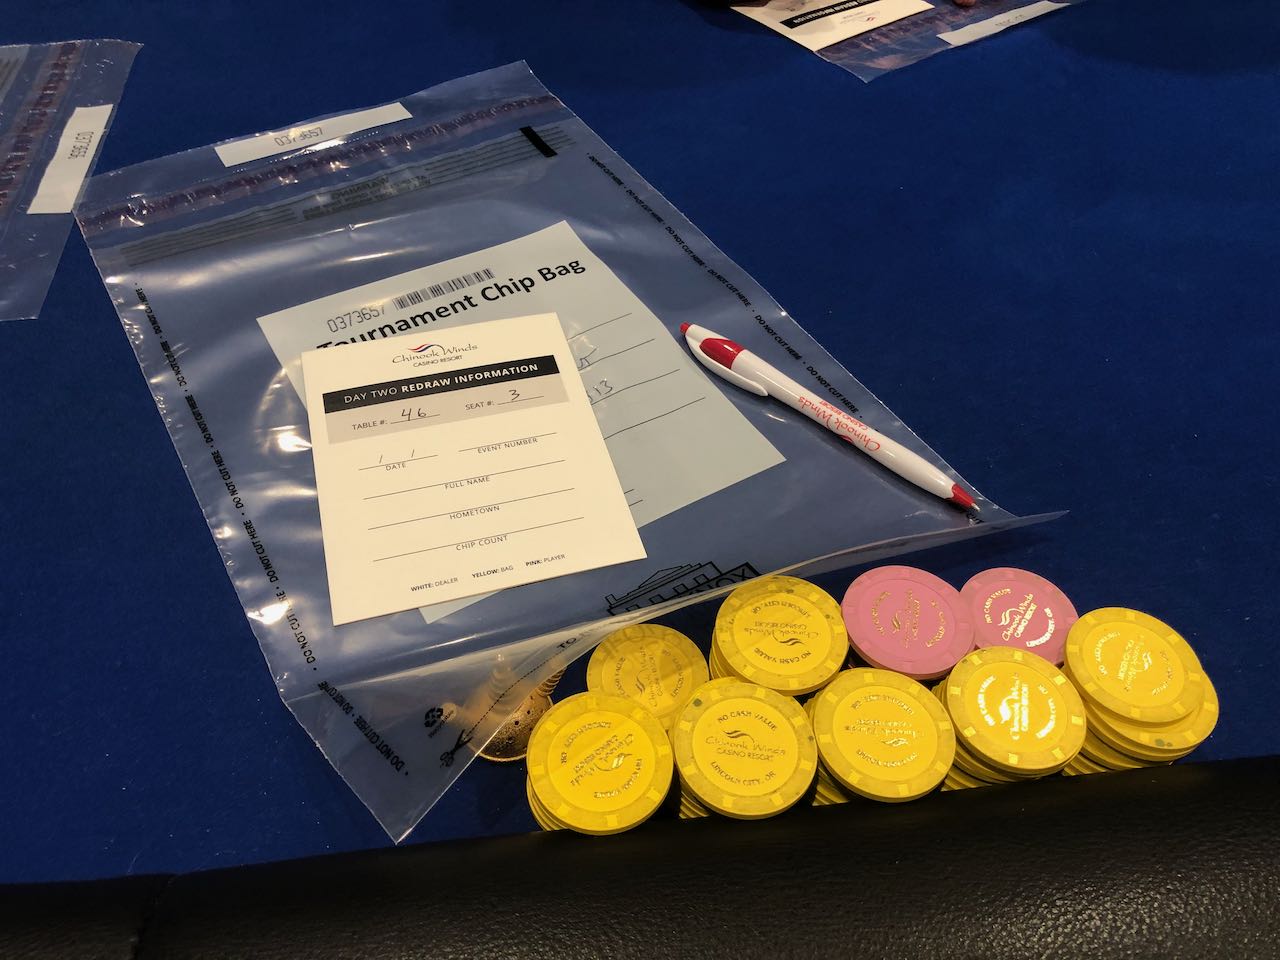
Week 4 was empty up to the day I went down to the Chinook Winds PacWest Poker Classic. I’d been hoping to make some of the non-Hold’em tournaments mid-week, but my work schedule did not cooperate, so I was locked into heading down for the $225K Guarantee NLHE Main Event on Saturday. I showed up just after the event started and made it about five hours before I flamed out. They blew out the guarantee, which was to be expected after a successful week where most of the fields leaped over last year.
After busting the Main. I walked over to the cash games to play some Big O at the table with my roommate for the night, Brad P. On the very first hand, I doubled up after a guy at the far end of the table called off against my nut-nut hand. Then I lost most of it to the guy next to me with a questionable call of my own just a few hands later. I didn’t get up, though, and ground my withered stack back up to a 33% ROI after 90 minutes. Brad stayed on at the table, I went to the room and played an online 8-Game where I ended up only 5/7.
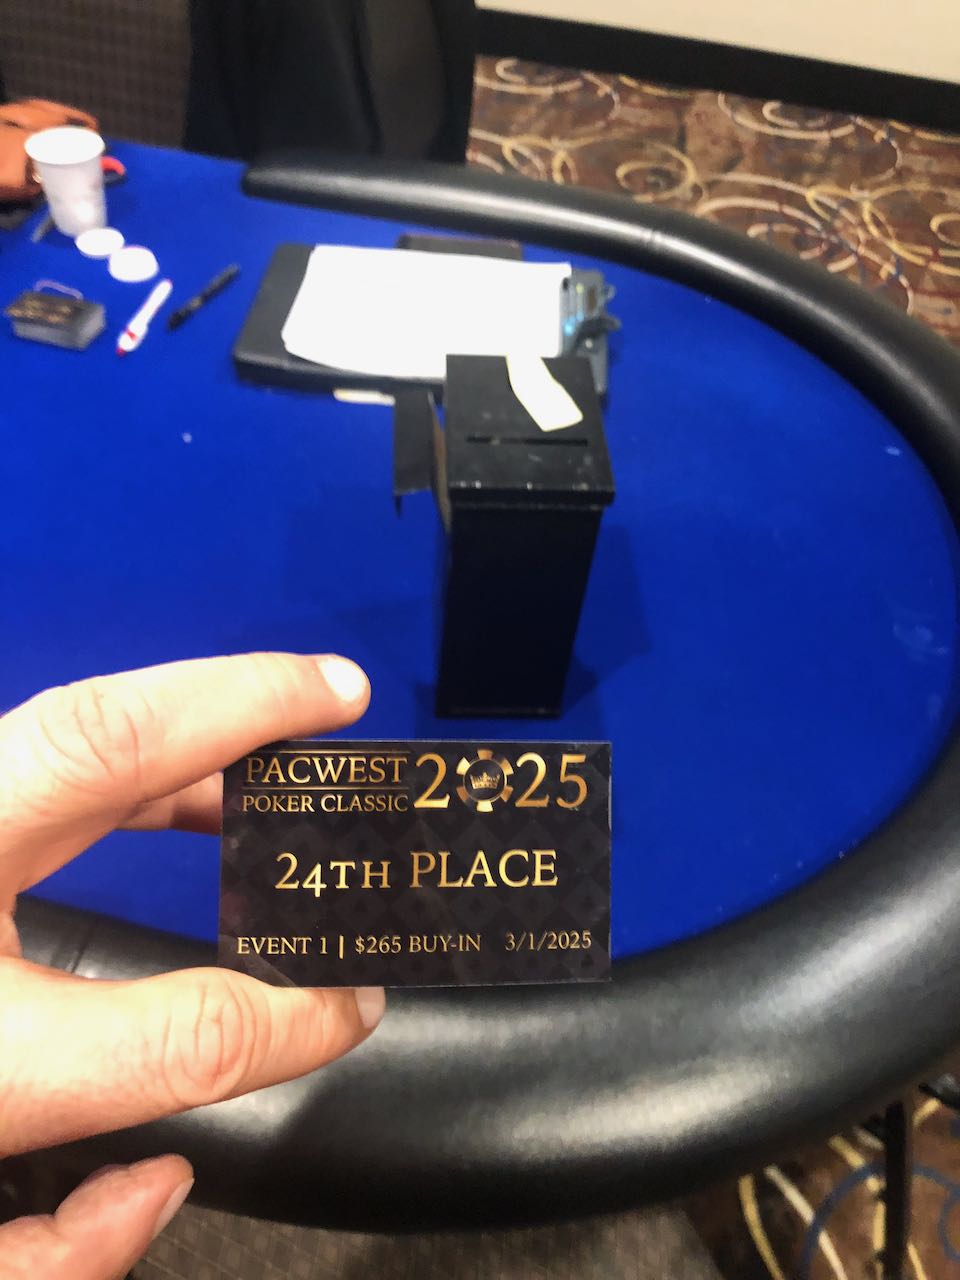
The next day, I hung around to play the last event of the series, the $5K GTD Limit Omaha Hi-Lo/7-Card Stud Hi-Lo. Made it to within sniffing range of the money, though I was short a lot of the last hour. It only paid 5 places; I made it to 14th of 46.
My last tournament of the month was another min-cash at Chainsaw Poker, 112% ROI for 3/13 in Stud/8.
April started off much the same as March: bottom of the stack finishes in online HORSE, NLHE Bounty, Omaha/8, and another NLHE Bounty in the first couple of weeks. I’d slowed down a bit because I was sort of saving myself for some live games at the end of the month.
Portland Meadows ran a brief Bounty Series in mid-April, with a $400 buy-in NLHE Progressive Knock-Out Bounty as the main event.
I was down to half my starting stack after the first half hour before I started to catch some wind. I was back over start by the end of the second level (30 minute levels) after a guy with a flush draw shoved into my top pair / top kicker and didn’t make it. Doubled again by the end of level three after flopping a set of kings and my opponent caught a set of jacks on the river. Both of us were a little cautious because of a monochrome flop, but I still called his river bet.
Picked up a couple of bounties early (initial bounties were $50 cash, $50 toward your own bounty). I held steady at about 100K (starting was 30K) for several hours, going from 3x average to 2/3 average. The number of tables was never large, there seemed to be a lot of re-entries (total of 140 entries). We were down to 3 tables after six-and-a-half hours.
One hand with kings under the gun ended up with me getting $125 in cash and a bunch of chips, plus, I crippled another player (but someone else got his bounty chips). Seven hours in, I was up to 320K while the average was 200K. 40bb on the bubble (18 places paid).
Nearing the end of the eighth hour and the final table, I raised ace-king against an aggressive player who had a big stack of bounty chips and who’d lost a bunch of chip chips. The flop was KJx and I bet 5bb as a continuation. The aggro player shoved for a total of 8bb, then the chip leader reshoved with a covering stack. I had to call. The smaller stack had a flush draw and the big stack had king-ten, so I was ahead and stayed ahead, essentially tripling up as well as picking up a couple hundred dollars in bounties. Soon after, we were at the final table, where I had a fifth of the chips in play with 55bb.
At the final, I crabbed my way around for a couple of hours, not really picking anything up I could make a move with, drifting down to 12bb after 90 minutes. The average stack was just 21bb when we were 5-handed. My last hand, I open-shoved 9bb with KJ, and made it through to the big blind player who had just a bit more than me and a pair of fours. He flopped a set and got a good pile of bounty chips. My payout was half the amount for the top two spots, plus about $800 in bounties. Just under 10 hours and 400% ROI (after spreading the love with some tips).
Final Table Poker Club opened up in April 2011, simultaneously with the US Department of Justice coming down on online operators PokerStars and Full Tilt on Black Friday. That was my launch into the world of live poker. I’d only been playing in a home game and online for three years (at least since the mid-1980s) but when Black Friday closed down online poker in the US for the most part, I started looking for alternatives, AND BY JUNE I’D FOUND MY WAY TO Portland Players Club at NE 60th & Glisan, Aces Players Club at SE 26th & Powell (each just two miles from my house, though in opposite directions), Ace of Spades on SW Barbur Blvd. (where The Game has been for many years now), and—by late May—Final Table, in their original location at NE 122nd & Glisan.
Over the years, I’ve played more than 425 tournaments at Final Table (one of the things I had to do immediately after Black Friday was to write my own poker tracking app, because I couldn’t just rely oin PokerTracker any more), 83 of them (7 a month on average) in 2016. Back before COVID, I did a revamp of the Final Table web site in exchange for a couple years of free door fees (they add up!), which would have been an even sweeter deal if that hadn’t overlapped with me telling my wife I was ramping back my playing schedule when she retired.
So April was their 15th Anniversary Series, culminating in a $50K Guarantee. You always have (irrational) high hopes coming off a good score like the PKO had been for me. I ended up rebuying in level 1 after making a bad call. Even the post-rebuy was a struggle as I kept losing chips; despite felting three players with shorter stacks by the end of level 4 I still only had 1.5 times the starting stack.
Ten minutes before the end of rebuys, I picked up a pair of kings (K♣K♦) under the gun, and made a min-plus raise. There were a couple of callers, then the big blind made a large 3-bet. I jammed, the callers folded, the big blind called and showed queens (Q♦Q♠). J♥T♠9♣ on the flop, the nine paired on the turn (9♥), so I went from winning about 80% of the time to 75% of the time (when he picked up the straight draw), to 85% on the turn until the river Q♣ when I made a straight.
I wasn’t about to take the second (and final) rebuy after that. It was time to go home. Saved myself the add-on, as well. Brad P late registered and lasted longer than I did but busted a few hours later before the money, which was not insignificant for a $200 buyin. Happy 15th Anniversary to Ben May and the folks working with him at The Final Table!
My last two games of April were on Chainsaw Poker. Another bottom-half finish in a Limit Omaha Hi-Lo game, then an outright win in a small Pot Limit Omaha 6-Max where I made it to the money as the overwhelming chip leader, then had to battle my way back in heads-up when the challenger managed to double up a couple of times and surpass me before I finally won. Just 333% ROI, but a nice way to cap off a couple of good months (well April was good, anyway).
Big congratuations to Adam Natress, who made back-to-back first place finishes at the Little Creek Casino South Sound Poker Series in Washington and the World Series of Poker Circuit Lake Tahoe. The Lake Tahoe win was his largest-ever cash (and was the week before the South Sound event). Those cashes put him in a good spot to surpass the million-dollar mark this summer. Adam was interviewed this past week by Oregon Public Broadcasting’s Think Out Loud.
I’m writing this Sunday, May 10, which was the last day for long-time PokerStars announcer Joe Stapleton, a staple if I say so myself of my poker consumption diet for more than a dozen years. I’ve watched most of the European Poker Tour and many of the PokerStars Sunday Million live streams presented by Stapleton and James Hartigan. Their Poker In the Ears podcast has always been top on my list of listens (I was a contestant on Superfan vs. Stapesfive years ago this month). I always thought he was amusing, anyway.
Looking forward this next week to the Portland Meadows Poker Classic, where I’m hoping to put some of that PKO money to use in the $100K Guaranteed NLHE Main Event as well as a couple of others. No idea yet if I’m going to be able to get away to Las Vegas for Poker Summer Camp, but I’m hopeful this year!
I have to admit that a lengthy losing streak doesn’t make me rush to the keyboard to update the old blog, not even to celebrate its 15-year anniversary back in December.
October was a complete brick, with eight tournaments (only one of which was live). Then I got heads-up in a live NLHE Freezeout at Portland Meadows for my first game in November but placed in the lower 50% of the next six games, finishing off the month with a two-way chop in a very small online game.
My birthday treat was a miss in the Meadows Big O Championship Satellite, where I made it at least up into the top 25% on my second bullet (after going out on the first hand with my first). Did about the same in Final Table’s Big O tournament just before Christmas, then had a win in a small online NLHE game on Boxing Day to close out my poker year.
I picked up the pace but not the bucks in January with 17 events, hoping maybe The Year of the Fire Horse would prove auspicious. Started off with another second-place finish in a small NLHE tournament, then losses in a PLO/8 Bounty, PLO Heads-Up, another NLHE Freezeout at Meadows (though with a bigger buy-in), an 8-Game Mix, and a NLHE Bounty.
Was leading the field in a HORSE tournament but tripped up on a couple of Razzhands and ended up just in third (but a cash). Then losses in PLO/8 6-Max (2), HORSE (2), 8-Game Mix, Omaha/8, and 7-Card Stud/8. Heads-up in a small, live NLHE, then min-cash in 8-Game Mix 6-Max, and a bottom half finish in Omaha/8.
February started a lot quieter, with a shot at Final Table’s $20K GTD NLHE First Friday (made it into the top third but still a long way from the money), an online 8-Game Mix, another little online NLHE chop, and a fifth of seven finish at the old home game, then 4/5 in a PLO online. But the month finished with two cashes in Chainsaw Poker games: 3/17 in PLO/8 6-Max and 2/14 in 8-Game Mix.
I’m hoping to make some of the Chinook Winds PacWest Poker Classic at the end of March and some of the special events in town (though probably not the $1,000 Heads-Up tournament)!
August started out hot. I was going to try to play a game a day. Missed the first couple, then took 2nd in a single-table PLO/8 tournament, played the home game the next night and got sucked out on by a player who’d doubled up twice from nothing, did poorly in online Chainsaw Poker 8-Game and Stud the next couple nights, then finally made it back to the Final Table when I’d spaced out on the fact that the month had started on a Friday, so the 8th wasn’t the First Friday $20K NLHE, it was just a $10K guarantee. That didn’t matter anyway, I went out 60/73 after a couple of hours.
Then I hit a real drought. Xfinity was doing some network modifications in the neighborhood, and all of a sudden my IP address was showing up as if it was across the river in Vancouver, Washington, which caused issues with playing on the PokerStars app because Washington state bans even play money online poker. That took more than two weeks to resolve. I could use my phone as a hotspot for my iPad, but that wasn’t as simple as just picking up the iPad or using my computer. Played a NLHE Bounty that was and busted in the middle of the pack without even getting a bounty.
By the next Beaverton Quarantine event a week later, I was back in good graces with PokerStars and chopped the top spot of a small NLHE tournament. The next night, I got sucked out on on the river twice in three hands in a Chainsaw PLO game and lost 2 buy-ins. That same day was another PLO/8 game where I was the first player out. So that was August. A total of nine events for an entire month.
The Final Table First Friday for September was a short one for me. Just 30 minutes, busting just before the end of the rebuy period. That got me home in time for a Beaverton Quarantine PLO/8 Bounty where I busted just short of the money and took just one bounty.
September’s PacWest Poker Classic at Chinook Winds Casino has always been problematic for me because it’s often straddling my wife’s birthday. This year was no exception, and I didn’t make it down for any events.
The rest of the month was mostly ChainSaw Poker PLO/8 games and a single 8-Game, where I took a min-cash for 3rd place. It was the only cash for the month, though. The month was even sparser with just seven events!
Just twenty-six events over this two-month period. 16 of those were online with Chainsaw Poker, whose members (not me!) had an impressive showing at this summer’s World Series of Poker in mixed events. One of the admins calculated that every $1,500 buy-in mixed event had at least one member of the club, and there was one final table where every person was a member.
Sadly, my performance in the club this past couple of months fell off from the previous months, with a couple of bubbles, a Stud/8 where I got crushed on the river after being dealt rolled-up trip 7s and I ended up going out 12/17 when I should have been a chip leader going into the second half of the tournament. Down about nine buy-ins here.
Capped on every street
The home game in June had more players than it has for quite a while—back in the oughts we sometimes went to three tables—but I bubbled this one as well in 4th place.
My two shots at Portland Meadows: a 5-Card PLO Lockout and a 5-Card PLO Bounty were busts. Didn’t make it much past the break in the bounty (and this time I didn’t get a bounty to salve my feelings), and while I made it to the final third of the players in the Lockout. What’s a Lockout you might ask? This is how Meadows describes it:
What is a lockout tournament? In this 5 card pot limit omaha tournament there are no blinds, instead the button posts an ante every hand and action starts to the left of the button. Players may call the ante or fold preflop. Once the action gets back to the button, they can check or raise; raising re-opens the action for everyone!!!
Had the 2nd nuts in the bounty tournament that knocked me out early and I went for a rare rebuy, but that still had me out 30 minutes after I got there. 3 buyins down for Meadows.
The Beaverton Quarantine game was a bust, too. Just one cash out of seven tournaments and that was in one of the smaller NLHE bounty games. So down four buyins, but at least they’re small.
Missed out entirely on this summer’s action in Las Vegas, and I wasn’t able to get away from town even for the Chinook Winds Summer Poker Classic.
I can’t close this out without mentioning that I did go out to Final Table Poker Club for their June First Friday $20K GTD NLHE tournament, but found out at the door it had been cancelled because one of the dealers had a medical emergency in the afternoon and later passed away. Most players in the Portland-area community know how hard the volunteer dealers here work, and how much the clubs and the whole poker ecosystem here depends on them, so it was nice to see how everyone came together when something like this happens.
Coming up in August? Who knows? None of my poker plans the past few months have panned out, but starting the 20th there is the Wildhorse Summer Poker Round-Up (the winner of spring’s Main Event did just make 2nd place at the WSOP Main Event), and at the end of August, it’s the Wild West Poker Tour atPortland Meadows, with the Chinook Winds Fall Poker Classic [Facebook group link] right on its heels in early September. Crossing my fingers!
It’s been a busy couple months here at Mutant Poker, even though my playing volume is still so much lower than it used to be and I don’t have any plans to go to Las Vegas this summer because of real-life stuff. Things to be happy about, though!
The Poker
First off, the past couple of months have beenprofitable, if not enormously so, which is always an accomplishment for someone who plays tournaments almost exclusively. I played just 25 tournaments (5 in April and 20 in May), with only two of those live (more on these types of numbers later).
No live poker at all in April, just a couple of small online home games and three in an online poker league. I bricked the first three (two Stud/8 tournaments and a NLHE Bounty), then won a single-table PLO tournament and a 21-entry 8-Game Mix that saved the month.
Just 6 of the 20 tournaments in May were NLHE (one live). I took first in two of the online home games. I was on a roll from the start in the live home game—nearly knocking out two players on the second hand—right up to the bubble when a player who’d clawed his way up from nothing at first lost a flip against me on the flop then hit a set on the turn and left me gasping for air and the booby-prize of less than half a buy-in.
The rest of the games were PLO/8 and PLO/8 Bounty (5), PLO (1), 8-Game Mix (3), HORSE (1), Stud/8 (3), and O/8 (1). I cashed in half of them and won the PLO, a PLO/8 Bounty, an 8-Game, and a Stud/8. The buy-in’s aren’t huge, the fields aren’t particularly big, but it’s great to be able to play something other than NLHE so regularly.
This would all theoretically hearken well for a WSOP trip, but no.
The Stats
May marks 14 years since I started keeping track of every real-money poker event (cash and tournaments). I built my own primitive online tracking tool just after Black Friday and a shift to live poker put a kibosh on automatically recording everything with Poker Tracker. At the time, I also had some ideas on how gauge the future profitability of tournament poker players who can be good even if they’re underwater financially.
Here are some stats on the local rooms I’ve played in in that time:
1 event at Big Stack Poker Club (does that put me at 100 with Brian Sarchi?)
1 event at Trio Poker Room
The bulk of that was in the years between 2011 and 2016, which is one of the reasons the Meadows number is so low, relatively. I went to work at the WSOP in the summer of 2016 after being mostly unemployed for years (hint: not the best time to pick up poker as a hobby unless you’re good at it) and came back to a job offer that took me off the streets during the weekdays when I had been frequenting Final Table, PPC, and Encore.
When I posted this in the NW Poker group on Facebook the other day, I got queries about some of the other fine rooms that have existed in the past 15 years. There are places I just didn’t get to. Sorry.
The Tracker
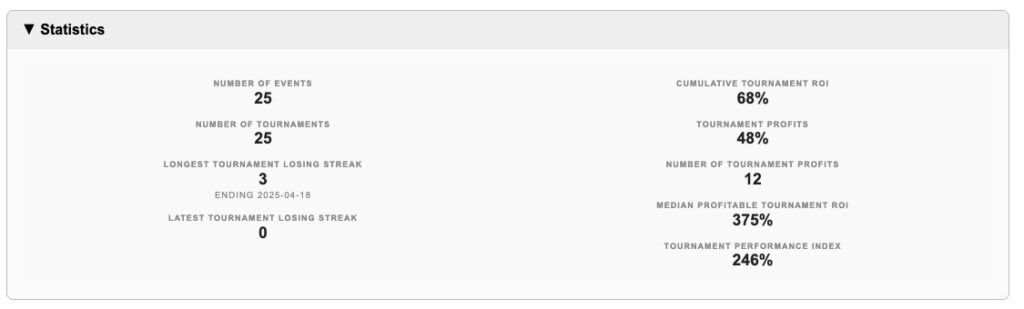
One of my projects the past month has been to update the software I use to track my poker playing. I wrote a crude system back in the spring of 2011 using mySQL (online database software) and PHP (a scripting language) but I’m a hack programmer. While I’ve been working with and programming computers since the days when we used paper tapes and punch cards, my formal programming training ended before any of the modern languages were even developed and more than a decade before the birth of the World Wide Web. Event the languages I did learn in depth (and wrote books and articles about) are long-dead. It’s been more than 20 years since I wrote my last book. So what I created was pretty unsophisticated but it did most of what I wanted it to do, which was to sort events by start and end dates, cash and/or tournaments, venues, minimum and maximum entrants for tournaments, and min/max buy-ins. Plus, it showed running totals for cost, payouts, and profits over the selected time period, median ROI for profitable tournaments, and the value of a metric I came up with called Tournament Performance Index, which is derived from a ratio of percentage of tournament cashed and the median ROI.
The “design” of the old tracker was pretty minimal, but it did use different backgrounds on tournaments and cash games, with varying shades for profitable events and unprofitable events. Despite the fact that part of my actual job is implementing the design for web sites, I didn’t put a whole lot of time into making it look nice, because I was the only person who was going to see it; I never had any intention to make it into a product—I’m not that kind of guy (i.e. a good businessman).
I’ve been wanting to do a revamp for a long time, and there were some features I wanted that were just too much of a hassle to add for just myself, but a recent evaluation of Codeium’s Windsurf Pro AI coding aid led me to do a complete rewrite of the PHP backend (API or Application Programming Interface that communicates to the database) and front-end. The front end was originally written in PHP, returning an HTML web page to the browser. My goal was to do something more modern, with a front end written in React, a JavaScript variant that does its work in the viewer’s browser. I’ve done a fair amount of work in React over the past five or six years, but most of it has been making data look pretty, not on actually fetching and slicing and dicing the data. If I was doing that for work, it’d be one thing, but any time I spend on tracker development is time I could be playing poker.
Windsurf certainly didn’t do the job instantly. Nor did it execute instructions with perfection. I found that with some tasks, once a component had been built, it was at times far more difficult to refine the component to get it to do what I wanted than it was to throw it all away and start over, knowing where I’d run into problems on the prior attempt. But with a couple of days of work, the basics of the tracker had been completely rebuilt. With a few more days poking at it, it was on a par with the pool I’d built up in dribs and drabs over 14 years, and even had a few new twists. Plus, it was going to be far easier to add new features.
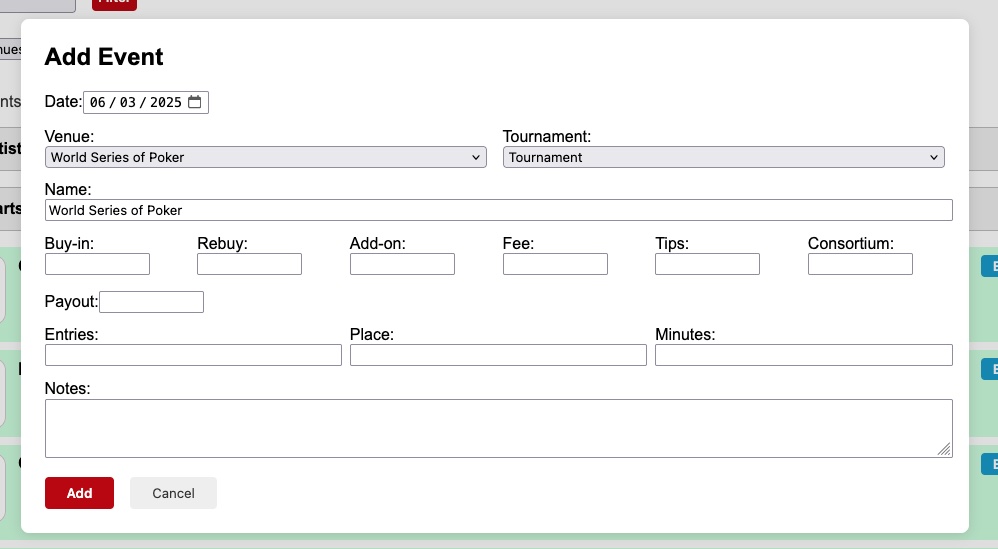
At the heart is a simple form where all of the content should be obvious except for consortium which was a long-ago plan for a few of the guys in our home game to share a portion of our winnings, which—apart from me paying out $300 for the first $10K GTD I final tabled at Encore Club back in 2011—never saw any other money transacted. I could probably get rid of that column but it’s in the database.
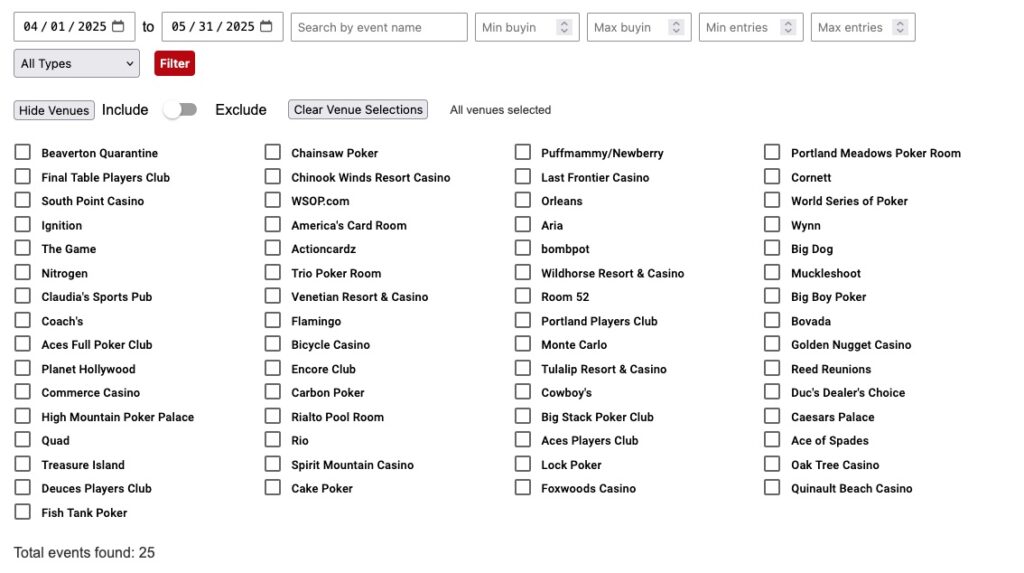
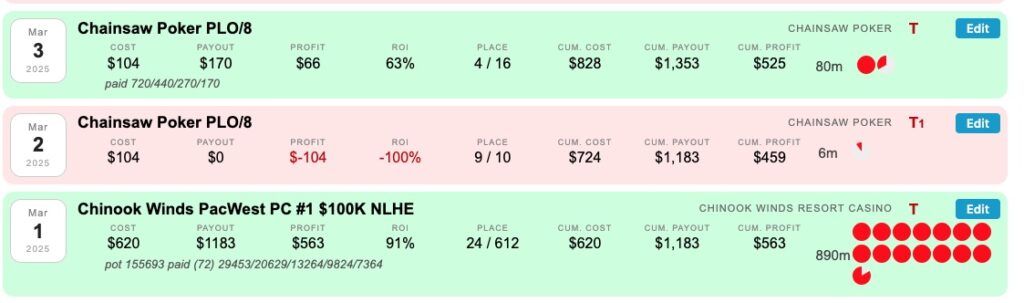
I can filter events by date, name, buy-in,, and number of entries, and can show or hide by venue. I’ve been taking photos of tournament screen when I bust out for almost 15 years now, so it’s pretty easy to keep track of that info even if I don’t feel like entering it in right away. Believe it or not, I’m more likely to forget to take a photo when I’ve cashed than when I’ve busted short of the money.
Individual events have their own row with the date, event name venue, event type (T here for three tournaments). A number after a T indicates the number of tournaments in a row without a profit (thankfully just 1 here). An identifier for the venue. Basic financials, placement, cumulative financials, notes under the number on rebuys, addons, and payouts (if I take them). And a little graphic indicator to indicate the number of minutes played in the event (one full circle for each hour).
Yes, I only lasted 5 minutes in the game in the middle. It was a max late reg!
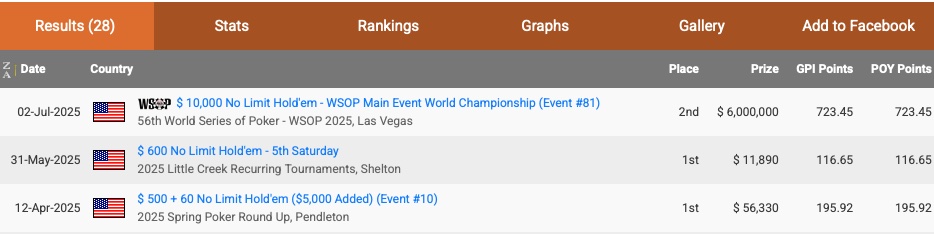
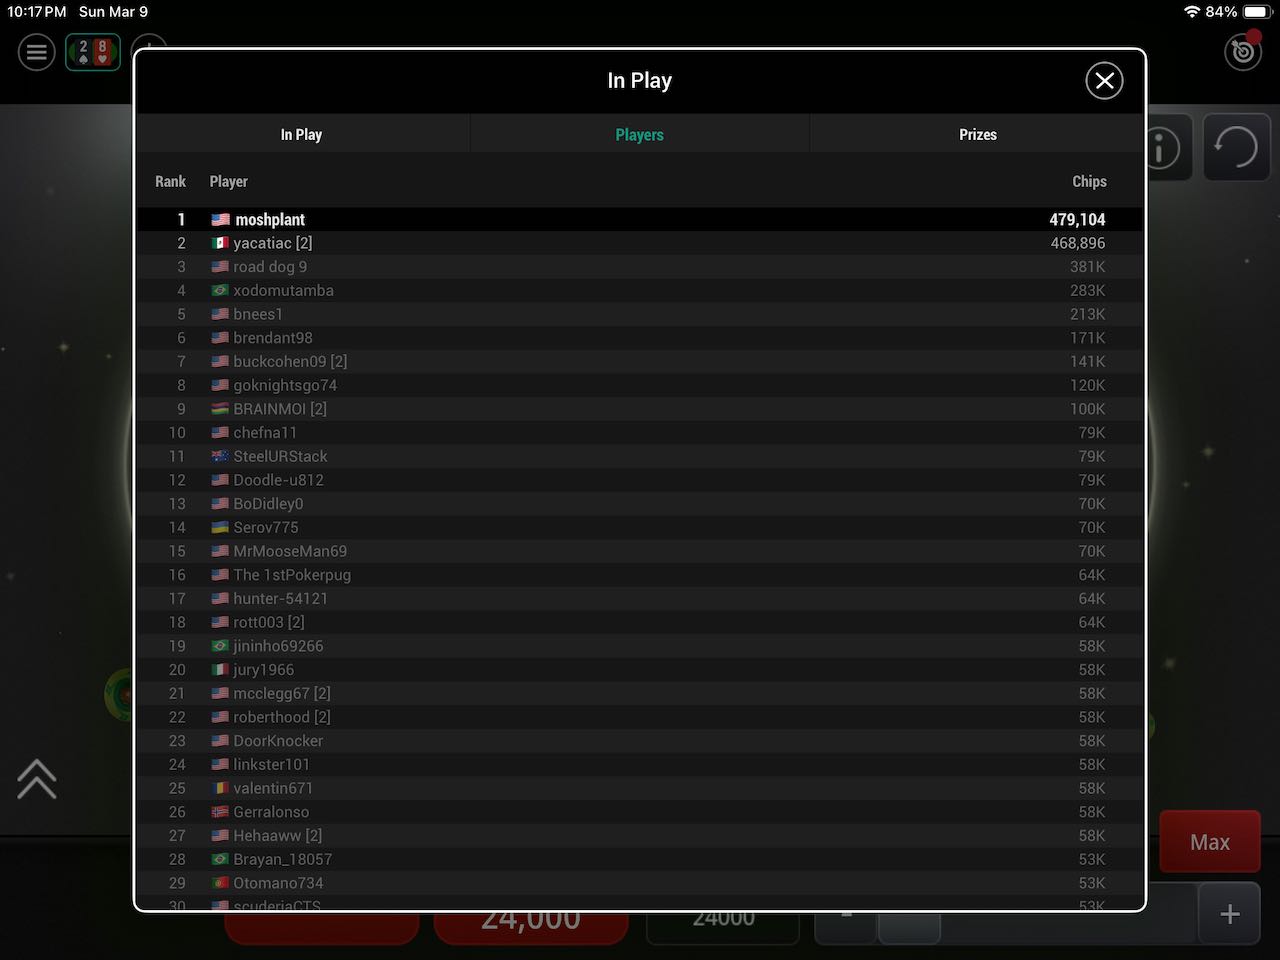
Up near the top are some tournament stats. As I said earlier, I’ve been running hot the past couple months, at least in my very minor-league circles.
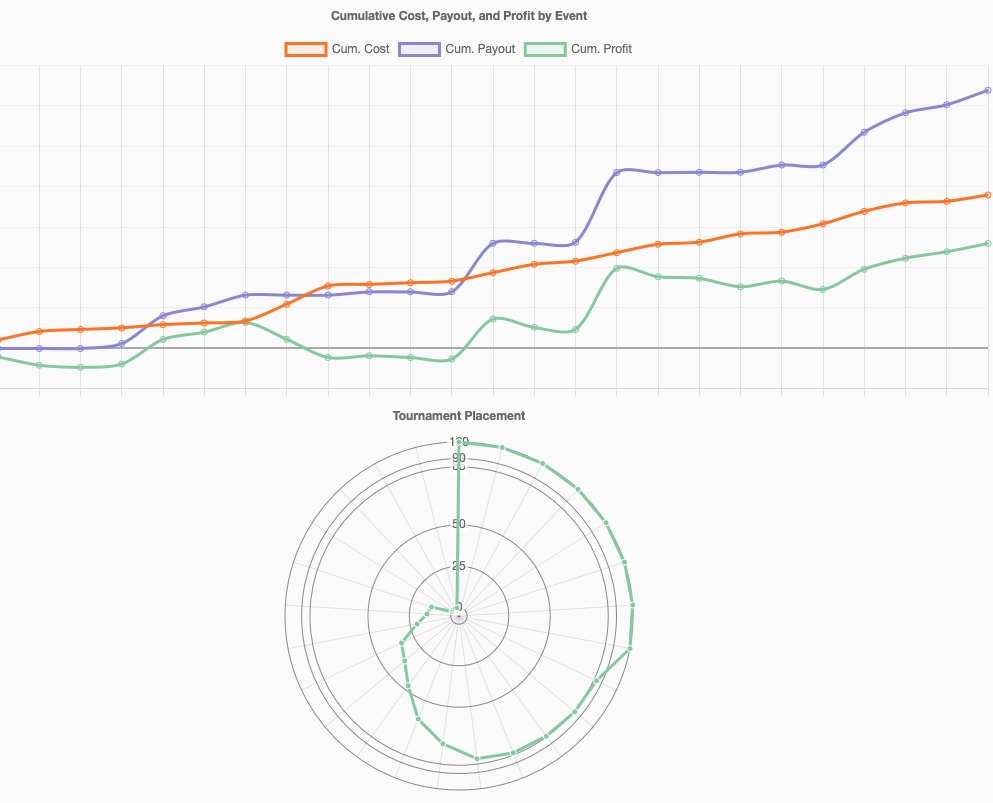
Finally, some charts. As a big believer in data science and poker–let’s call it Moneychip–I’ve made a variety of charts over the years to try to figure out what, if anything,I was good at, and just how good “good” was. Aside from the standard cumulative cost, payout, and profit line chart at the top, the radar chart below it shows me where I’ve finished in tournament fields as a percentage of the field. As I mentioned, it’s been a good couple of months, with the upper-right quadrant ofthe Tournament Placement chart showing 1st-place finishes in more than a quarter of the events over April and May (I was first out in several events, as well). My version of the chart has grid lines at 90% (the old standard for payouts in larger fields) and 85% (the standard at the WSOP in most events). but smaller events often pay higher percentages, if barely.
So. That’s it for this edition. I’ve got more charts to make. Maybe some poker.
Another couple of months of light pokering. The Chainsaw Poker league continues to be interesting, though I only had two min-cashes in 14 shots over February and March. So, no profits but I got to play 8-Game Mix, Stud/8, HORSE, PLO/8, and Omaha/8.
In the Beaverton Quarantine league, I only played a couple games during February, then four in March (including two on one night), winning two outright (a NLHE Bounty and NLHE) and ending another NLHE in a three-way chop. The other three (NLHE Bounty, PLO, and PLO/8 Bounty) I was dead last.
The original home game had a get-together in February and I got off to a good start with aces vs. kings in the early levels, pulling into the chip lead early on only to have the whole thing go gunnysack over the course of two hands after the end of rebuys and I ended up in 10th place out of 12.
I wasn’t able to make it down for much of the Chinook Winds PacWest Poker Classic, but I was able to get there for the opening weekend’s $100K GTD NLHE tournament. Got pasted early on and re-entered.
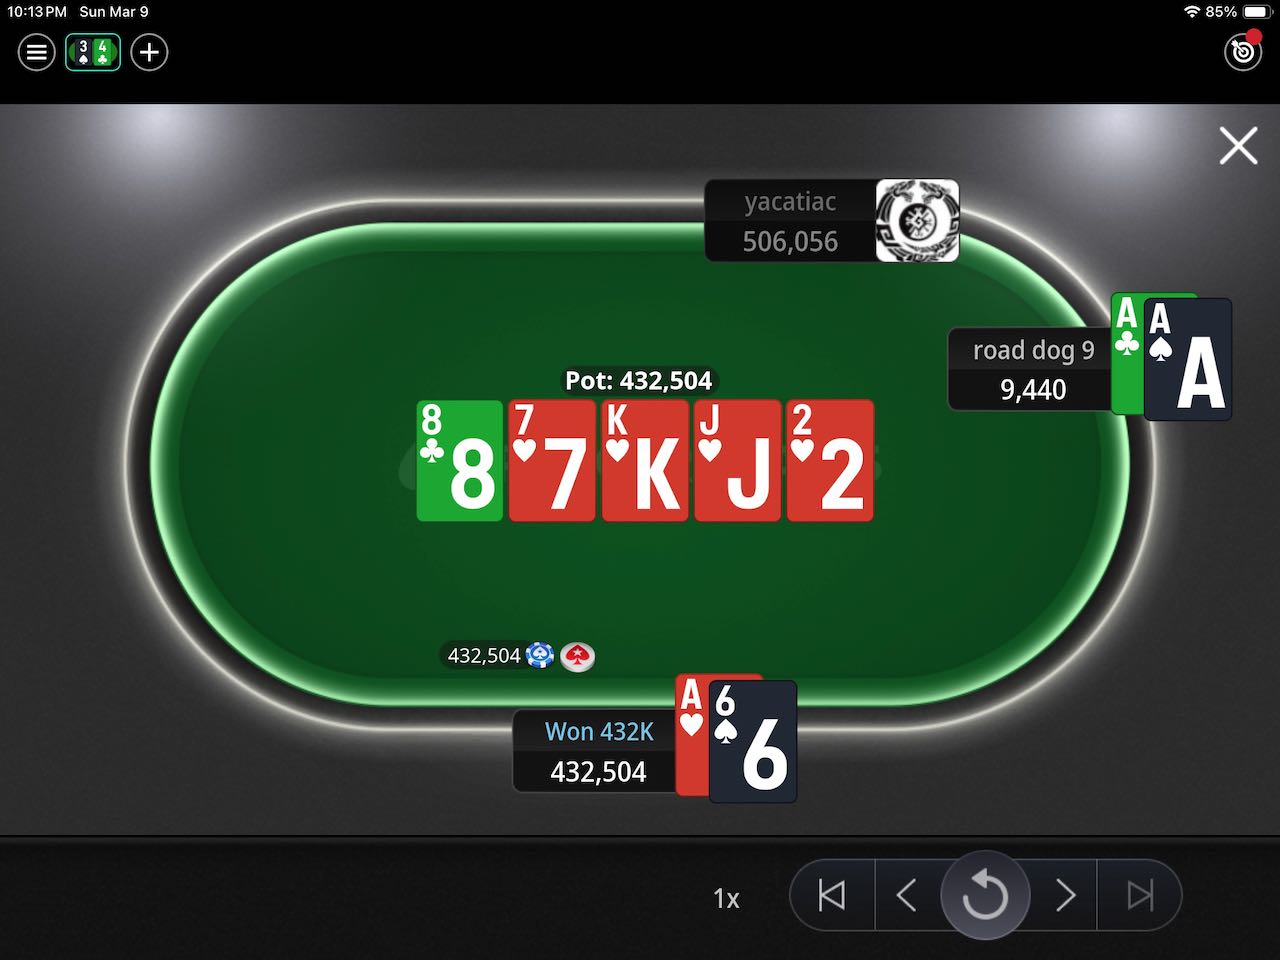
On the next-to-last hand before the end of registration break, I was down to 20bb UTG and opened AA, getting 4 callers. The flop was 964 rainbow; I continued for 4bb and a loose caller across from me plonked in more than my stack. I called, he shows 9T offsuit and the aces hold despite his straight draw on the turn. On the last hand before break, a well-known Portland-area player shoved in late position with a new stack over the same player’s limp. Shover says he’s all-in blind and shows 64 offsuit. The caller shows 63 off, hits a 3 and the shover’s knocked out.
I got another pair of aces against the same player and won another hand after registration closed, then a set of queens put me up about the necessary chip average for making Day 2 (although we were still a long way off).
The winner of the previous fall’s Main Event sat down on my left. She’s a very aggressive player, so there were advantages and disadvantages to that. A player in early position raised to 6bb and I called with TT on the button. She shoved 25bb on a 442 flop and I call. AK against my tens and she hits the ace on the river. My beautiful stack!
Half an hour after my peak and I’m down more than 100K in chips and feeling kind of sick. 36 players to the money (72 payouts) and I was down to 70K.
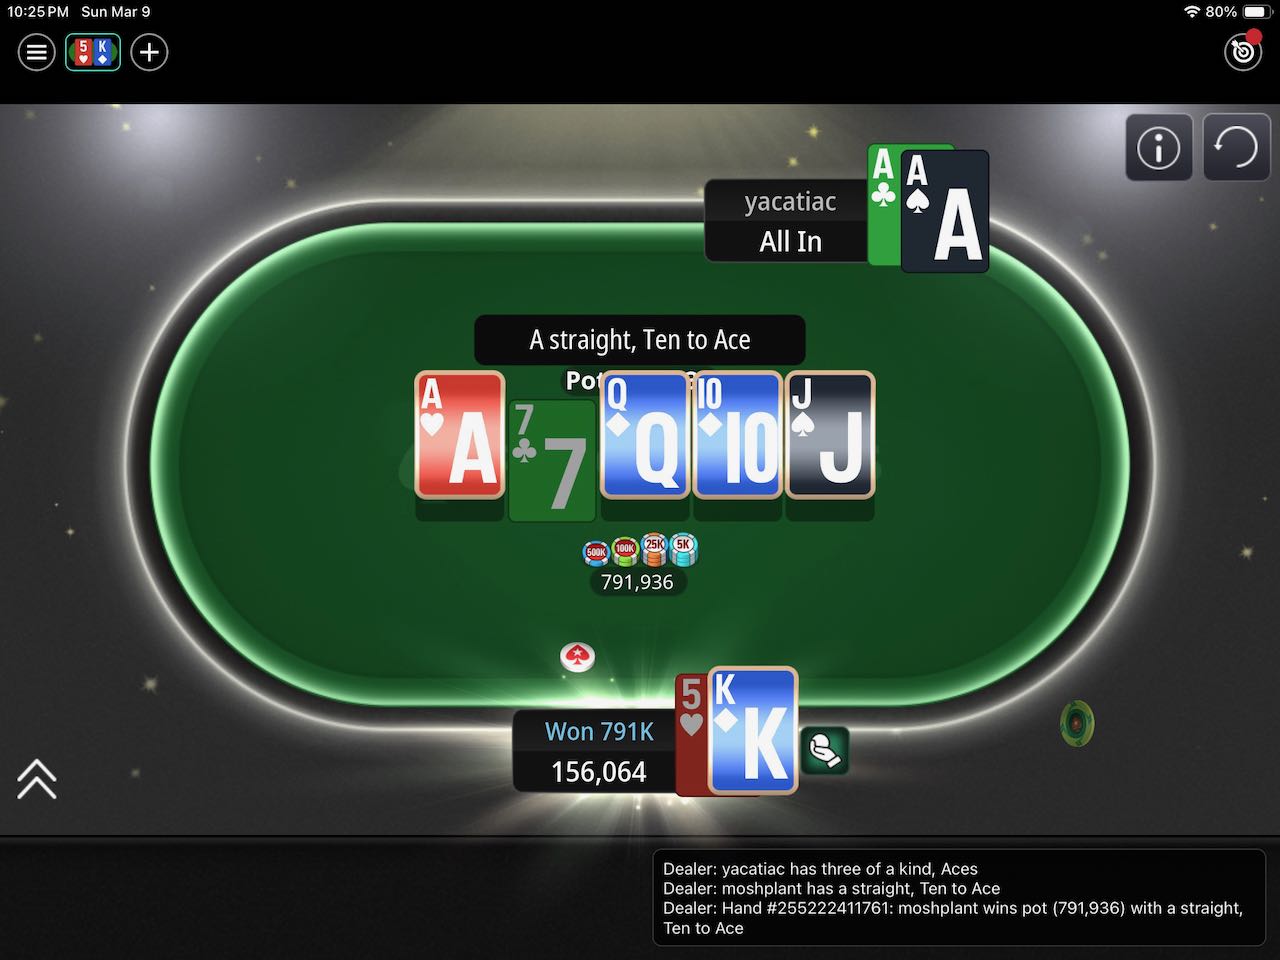
Got AA again and raised from early position; the former main event champ called and when the flop came K-high, I shoved my last 14bb. She thought for a while and called with KQ offsuit. The Q paired on the turn, but an 8 on the river paired the flop and I made the better two pair for a double up. She toasted off another 125K limping with an over pair and letting the BB make a straight with 64. At 3 to the money, she was very short on the next orbit when I raised QJ suited from the button. She shoved 5bb, I called vs her KK, flopped a gunshot straight draw and hit it on the river, knocking her out just short of the end of the day.
I ended up 43/72 of the players coming back for Day 2, but I was still in.
There were two very short stacks at the table at the start of the day but also two of the top 10 stacks. And one of the guys who used to play in our home game. When I talked to him about why he wasn’t coming any more, he mentioned it was because of one of the other players—and it wasn’t me! Unfortunately for him, he caught a set of nines against a flush draw that hit on the river and crippled him and he was out in the mid-60s.
Got a couple all-ins through without any calls to stay alive while I was in the 10-15bb range. We had some drama when a player got moved to the table and dumps a couple handfuls of chips in front of his seat, then wanders off during a hand before action gets to him to talk to a buddy at the nearby payout table. He came back and rooted through his chips saying he thought he had a 25K chip. One of the floor people finds a 25K chip in the aisle but says he can’t have that one since there’s no way to verify that it was his. That causes some chatter at the table and beyond until Forrest Auel comes over to say they’ve verified that it was his chip. All is well.
Ninety minutes into the day and I’d made enough to pay for both my buyins and my room for the night, so I was happy. Almost half the field was gone, but I was hovering in the 15bb range.
The Mutant Jack (AJ suited) paid off for a double up against 99. I shoved 15bb, hit the jack and a flush draw on the flop, made the flush on the turn, and picked up another jack on the river just for safety. Made it to the first break with 334K at the 10K/15K big blind ante level, so still only 22bb.
Slid down to about 200K, chopped a hand AK==AK, and finally hit the wall with 99 against AA.
Still less than a 100% ROI (given the re-entry) but it did make me feel better about the quality of my NLHE game.
Maybe too much better, because when I hit the Final Table $10K GTD NLHE on the next Friday, I didn’t even make the point where they posted the payouts, even after a rebuy and add-on.
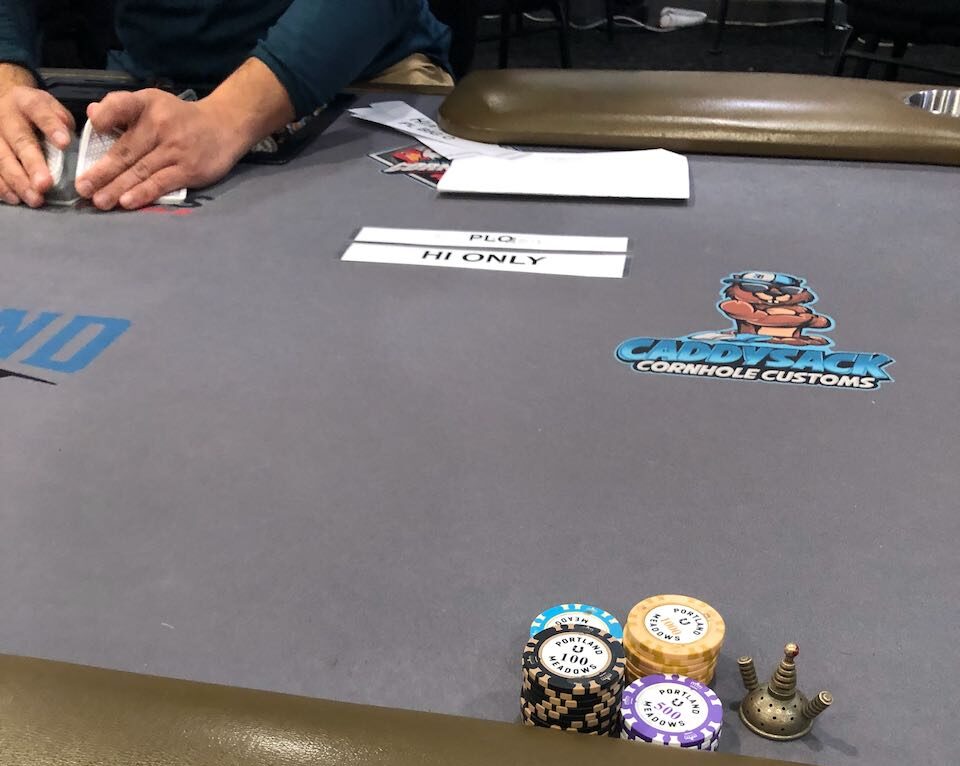
Portland Meadows ran a late-month mid-week PLO Bounty that sounded like just the thing, but it went very poorly for me and pretty much everyone else at my table as the guy in seat 9 was absolutely crushing everyone. You can see his stack below that was before the end of re-entry (after I blew my second stack with at least a chance of winning against his flopped set). By the time I left, more than half of the 40 bounties in play had been collected and I think he had about 15 of them.
WSOP CIrcuit Maryland Controversy
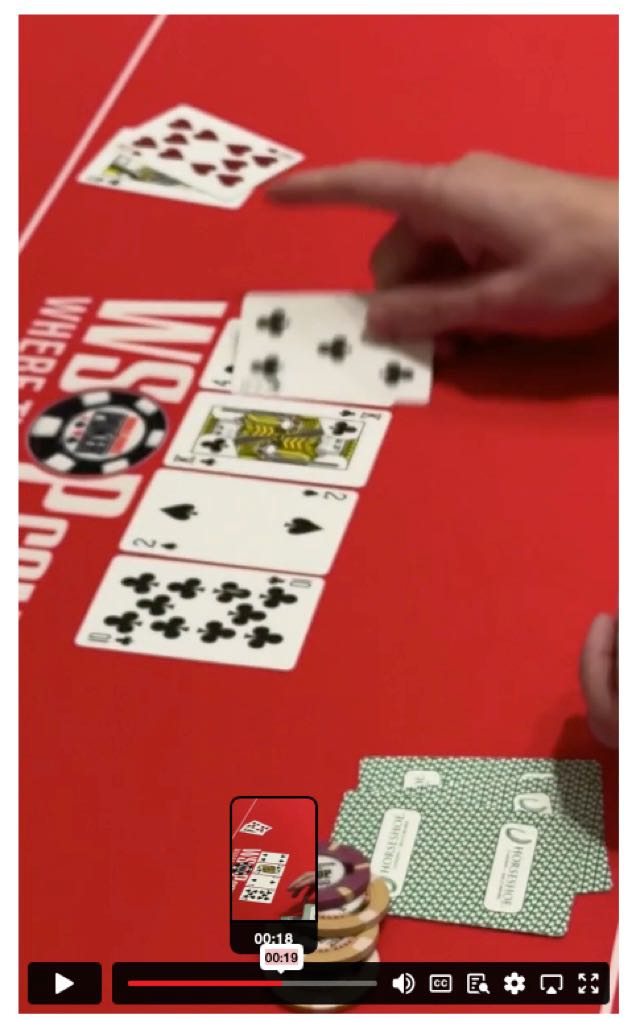
I’m late to the party on this story, where back at the beginning of March, the wrong player was awarded a pot, in a hand that knocked out a player in third place at the WSOPC Maryland NLHE Main Event. Divyam Satyarthihad Q♣️T❤️ vs A❤️3♠️, there were both flush and straight draws on the board by the turn, and both were completed on the river, after Satyarthi had paired on the flop.
Satyarthi was the short stack by a significant amount, with just about a million chips at the time he went all-in according to Poker.org, compared to more than 9 million each for the other two players.
The player who was awarded the pot, Maurice Hawkins, ended up winning the tournament after having to make a couple of come-backs against Dan Chalifour, and there’s been some shade thrown his way by a number of people (alluded to in the PokerNews Podcast episode covering the story) about whether he knew he’d actually lost the hand and was celebrating his straight as a away of distracting people from seeing the flush.
Most of the controversy about this has centered on whether reporters who see an error like this should speak up, even though in this case, the reporter didn’t see the flush themselves, likely until they were reviewing video to write up the hand.
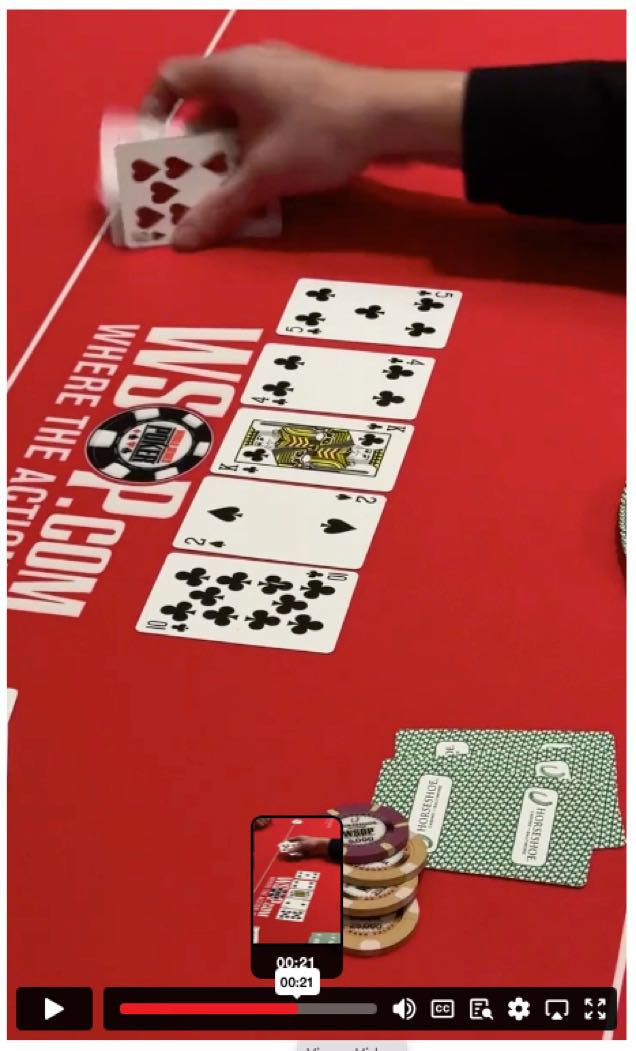
That video (shared on Poker.org) shows that less than two seconds pass between the time the dealer lays down the river card (at 0:19 seconds into the video, on the left) and the time he kills the winning hand (at 0:21 seconds, on the right). As the river card’s transiting the board, it’s obscuring the suits of other cards; and the Q♣️ in the winning hand is already partially obscured by the fact it’s on the bottom. By the time the hand’s being killed, there’s no way to see the suit of the card that would have made the win. Should Satyarthi have known that he had a club? Maybe, but so should the dealer. Another second or two of delay before the hand was killed would have made a difference.
How much of a difference? Satyarthi got $64,458 for third place. At the time he went all-in, his stack was worth about $72K according to an ICM calculator (with Hawkins’s worth about $115K and $112.5K for Challifour. Doubling up through Hawkins would have given Satyarthi another $7K in equity, mostly coming from Hawkins. He still would have been at a 4:1 chip disadvantage, but there was a point just a couple of hours later where Hawkins himself was down to what Satyarthi would have had if the chips had been awarded properly.
Play Money
Just been practicing my skills on PokerStars Lite.
It’s the run-up to a new poker year, with the Chinook Winds PacWest Poker Classic just around the corner at the beginning of March, and my poker purse is looking a little strained. I’ve already had inquiries from two friends about WSOP plans and frankly, I’m not sure it’s going to happen this year unless I pick up the pace a bit. The droughts feel even droughtier when you’re not playing as often.
Portland Meadows Big Game Series Big O, January 10, 2025
So I did play a bit more live this month, all at Portland Meadows because of their Mixed Game Series. I made three of the games on two days, busting way early in the Big O (I was not re-buying) on Friday night.
Portland Meadows Big Game Series Big Bet Mix Dealers Choice, January 11, 2025
The Big Bet Mix Dealers Choice game went better but I barely made the end of registration (still an improvement on the Big O). I hung around the club to wait for the PLO Big Bounty tournament in the evening, and once again failed to make the end of reg. All in all, a disappointing showing.
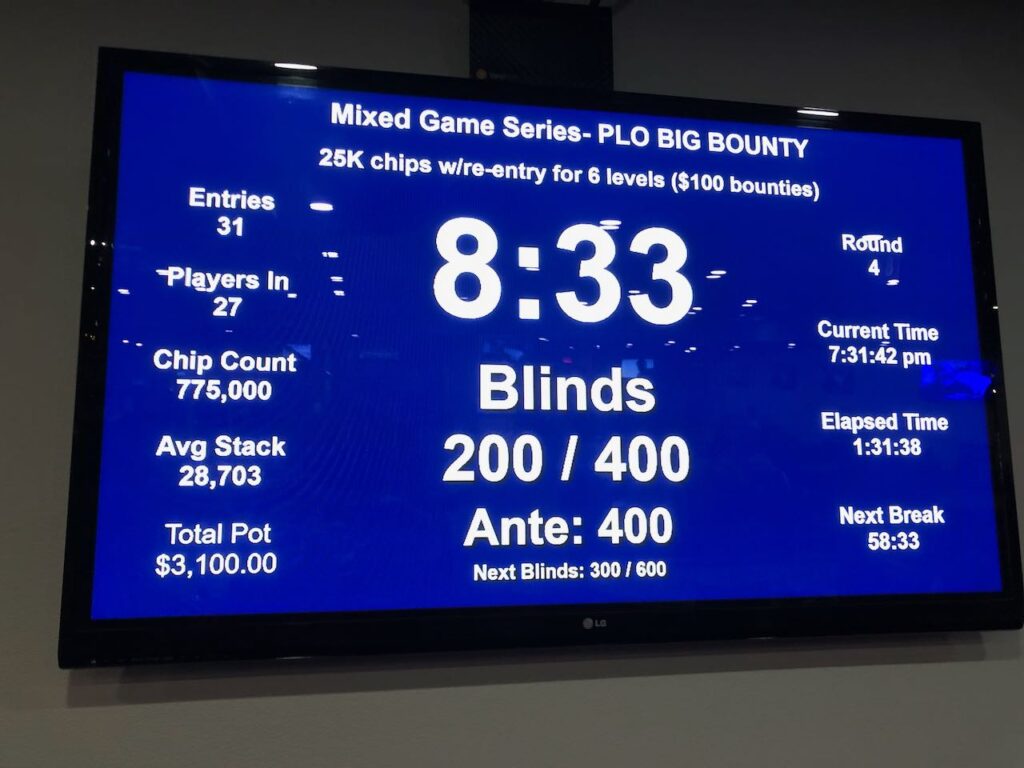
Portland Meadows Big Game Series PLO Big Bounty, January 11, 2025
I’d opened the month with a couple of Beaverton Quarantine online games (and I played another after getting home so early after the Big O tournament). I picked up a few bounties, but didn’t even make the entry fee back for one of them. Four games, four losses, with a slight offset from the two bounty games.
Played six tournaments with the Chainsaw Poker group online, Omaha Hi-Lo for one, a PLOHi-Lo, and four HORSE tournaments. Min-cashes in the PLO and one HORSE.
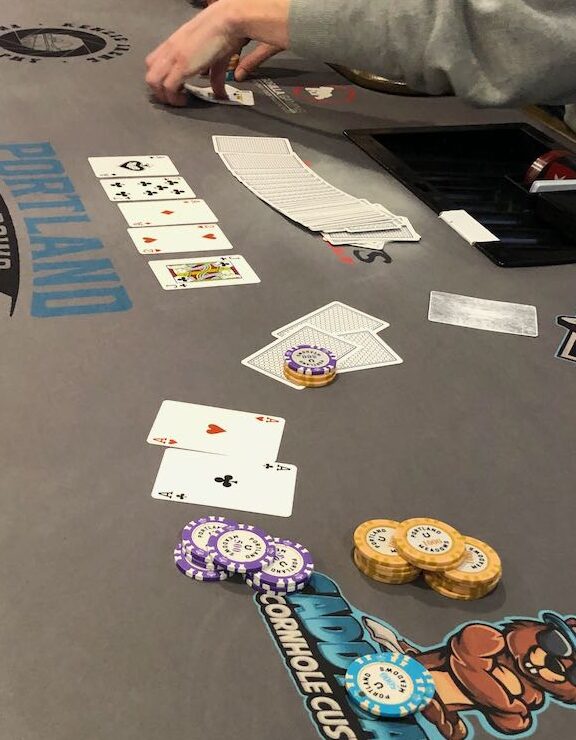
Wrapped up the month with another excursion (well, a couple) to Meadows. They had a Friday night satellite to their $500 entry Big Stack Freezeout tournament, and I took a shot. $80 (including door fee) seemed like a great bargain, even though I haven’t been playing a lot of No-Limit Hold’em.
I had a good start with a player in middle position making a raise when I was on the button with aces. I 3-bet him and he went all in with kings. The board rollout quads for me. I never got near my target stack for a satellite, but it was a standard satellite, not a Milestone, so I just had to stick it out.
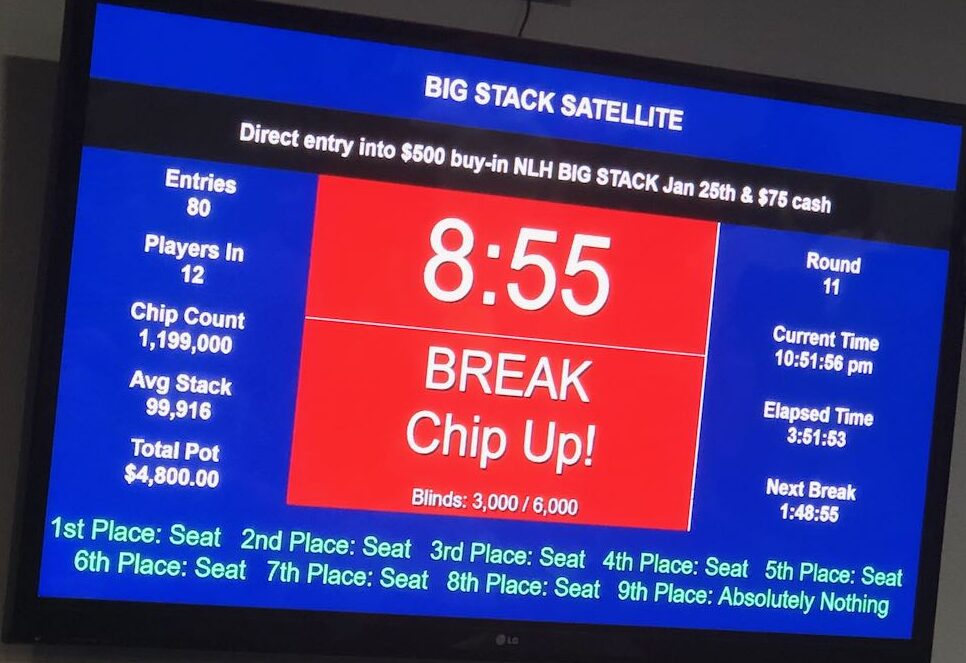
Portland Meadows Big Stack Satellite, January 23, 2025
My stack limped along at around 10bb most of the last half of the tournament, then after about 4 hours we were suddenly down to the final table of 9, with one person not getting anything. I didn’t catch exactly what was happening, but I heard that the player in seat 9 had somehow made it to the final without realizing they were playing for a seat into the next day’s tournament. I was in seat 3 in the small blind on the first hand, and when there were several limps ahead of me, I just folded. The flop was 973, seat 9 blasted off when it got to him, and he was called by the big blind. Heads-up, seat 9 had top-top (A9) but BB showed 73 and the race for seats was over just like that.
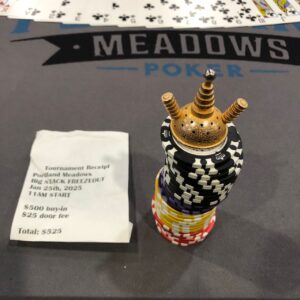
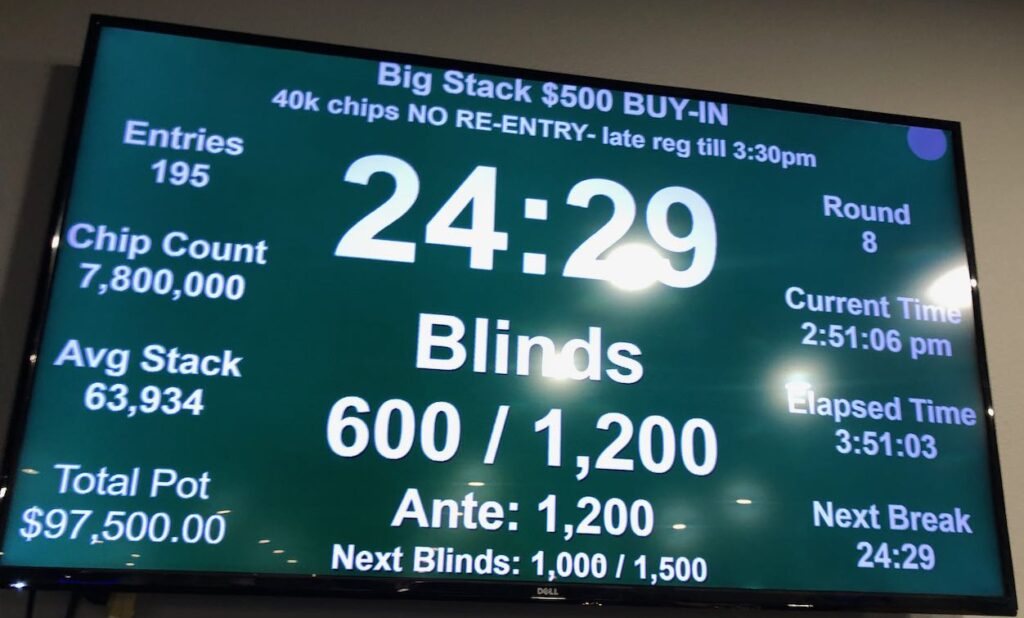
Portland Meadows Big Stack Freezeout, January 24, 2025
Sadly, it was all for nought (apart from the $75 cash payout that went with the satellite seat that almost covered by entry and door fee). Carl Oman ate my lunch several times during the day and I busted in round 8. Though I was glad that I made it past round 4 or 5, I was still rather disappointed that registration was still open when I was knocked out. The final prize pool ended up being an even $100K.
Portland Meadows Big Stack Freezeout, January 24, 2025. Bust-out shot.
Coming up for me this month, a couple of live home games (finally pulling my chips out of the garage to lend them to a friend); the Chainsaw Series of Poker, a series of online non-NLHE tournaments; Final Table has a special $20K GTD tournament on the 21st; then on the 23rd I need to make a choice between the Final Table Deepstack or a Portland Meadows Big O Special. Then it’s whatever I can get to for Chinook Winds the week after that.