The revised payout structure for the WSOP Main Event (ensuring at least $1M for every member of the November Nine and paying $15,000 to 300+ places beyond last year’s bubble) left a few holes in the 30 tiers of payouts from the 2014 event. Everything’s subject to change—depending on the number of entrants, of course—but by graphing the payouts provided by the WSOP and extrapolating from previous years’ payout levels, this is our educated guess as to what the rest of the structure would look like (based, as theirs were, on the number of entries in the 2015 Main Event and a $62,825,752 prize pool).
Payouts for 2015 in the chart below in bold are numbers from the WSOP’s news release about the payout modifications. Total payout comes to $6 off of last year’s prize pool (that’s just 0.000009% off target and about the price of a cup of coffee at the Rio)!
| Payout Tier | Places | # of Payouts in Tier | 2015 Estimated Payout | 2014 Actual Payout |
| 1 | 1 | 1 | $8,000,000 | $10,000,000 |
| 2 | 2 | 1 | $4,663,527 | $5,417,911 |
| 3 | 3 | 1 | $3,500,000 | $3,807,753 |
| 4 | 4 | 1 | $2,750,000 | $2,849,763 |
| 5 | 5 | 1 | $2,000,000 | $2,143,794 |
| 6 | 6 | 1 | $1,500,000 | $1,622,471 |
| 7 | 7 | 1 | $1,250,000 | $1,236,084 |
| 8 | 8 | 1 | $1,100,000 | $947,172 |
| 9 | 9 | 1 | $1,000,000 | $730,725 |
| 10 | 10-12 | 3 | $550,000 | $565,193 |
| 11 | 13-15 | 3 | $434,176 | $441,940 |
| 12 | 16-18 | 3 | $344,971 | $347,521 |
| 13 | 19-27 | 9 | $275,875 | $286,900 |
| 14 | 28-36 | 9 | $222,053 | $230,487 |
| 15 | 37-45 | 9 | $167,999 | $186,388 |
| 16 | 46-54 | 9 | $142,500 | $152,025 |
| 17 | 55-63 | 9 | $116,950 | $124,447 |
| 18 | 64-72 | 9 | $96,605 | $103,025 |
| 19 | 73-81 | 9 | $80,318 | $85,812 |
| 20 | 82-90 | 9 | $67,211 | $72,369 |
| 21 | 91-99 | 9 | $56,608 | $61,313 |
| 22 | 100-162 | 63 | $50,000 | $52,141 |
| 23 | 163-225 | 63 | $42,661 | $44,728 |
| 24 | 226-288 | 63 | $36,636 | $38,634 |
| 25 | 289-351 | 63 | $31,666 | $33,732 |
| 26 | 352-414 | 63 | $27,548 | $29,400 |
| 27 | 415-477 | 63 | $24,122 | $25,756 |
| 28 | 478-549 | 72 | $20,850 | $22,678 |
| 29 | 550-621 | 72 | $18,495 | $20,228 |
| 30 | 623-693 | 72 | $16,750 | $18,406 |
| 31 | 694-1000 | 307 | $15,000 | $0 |
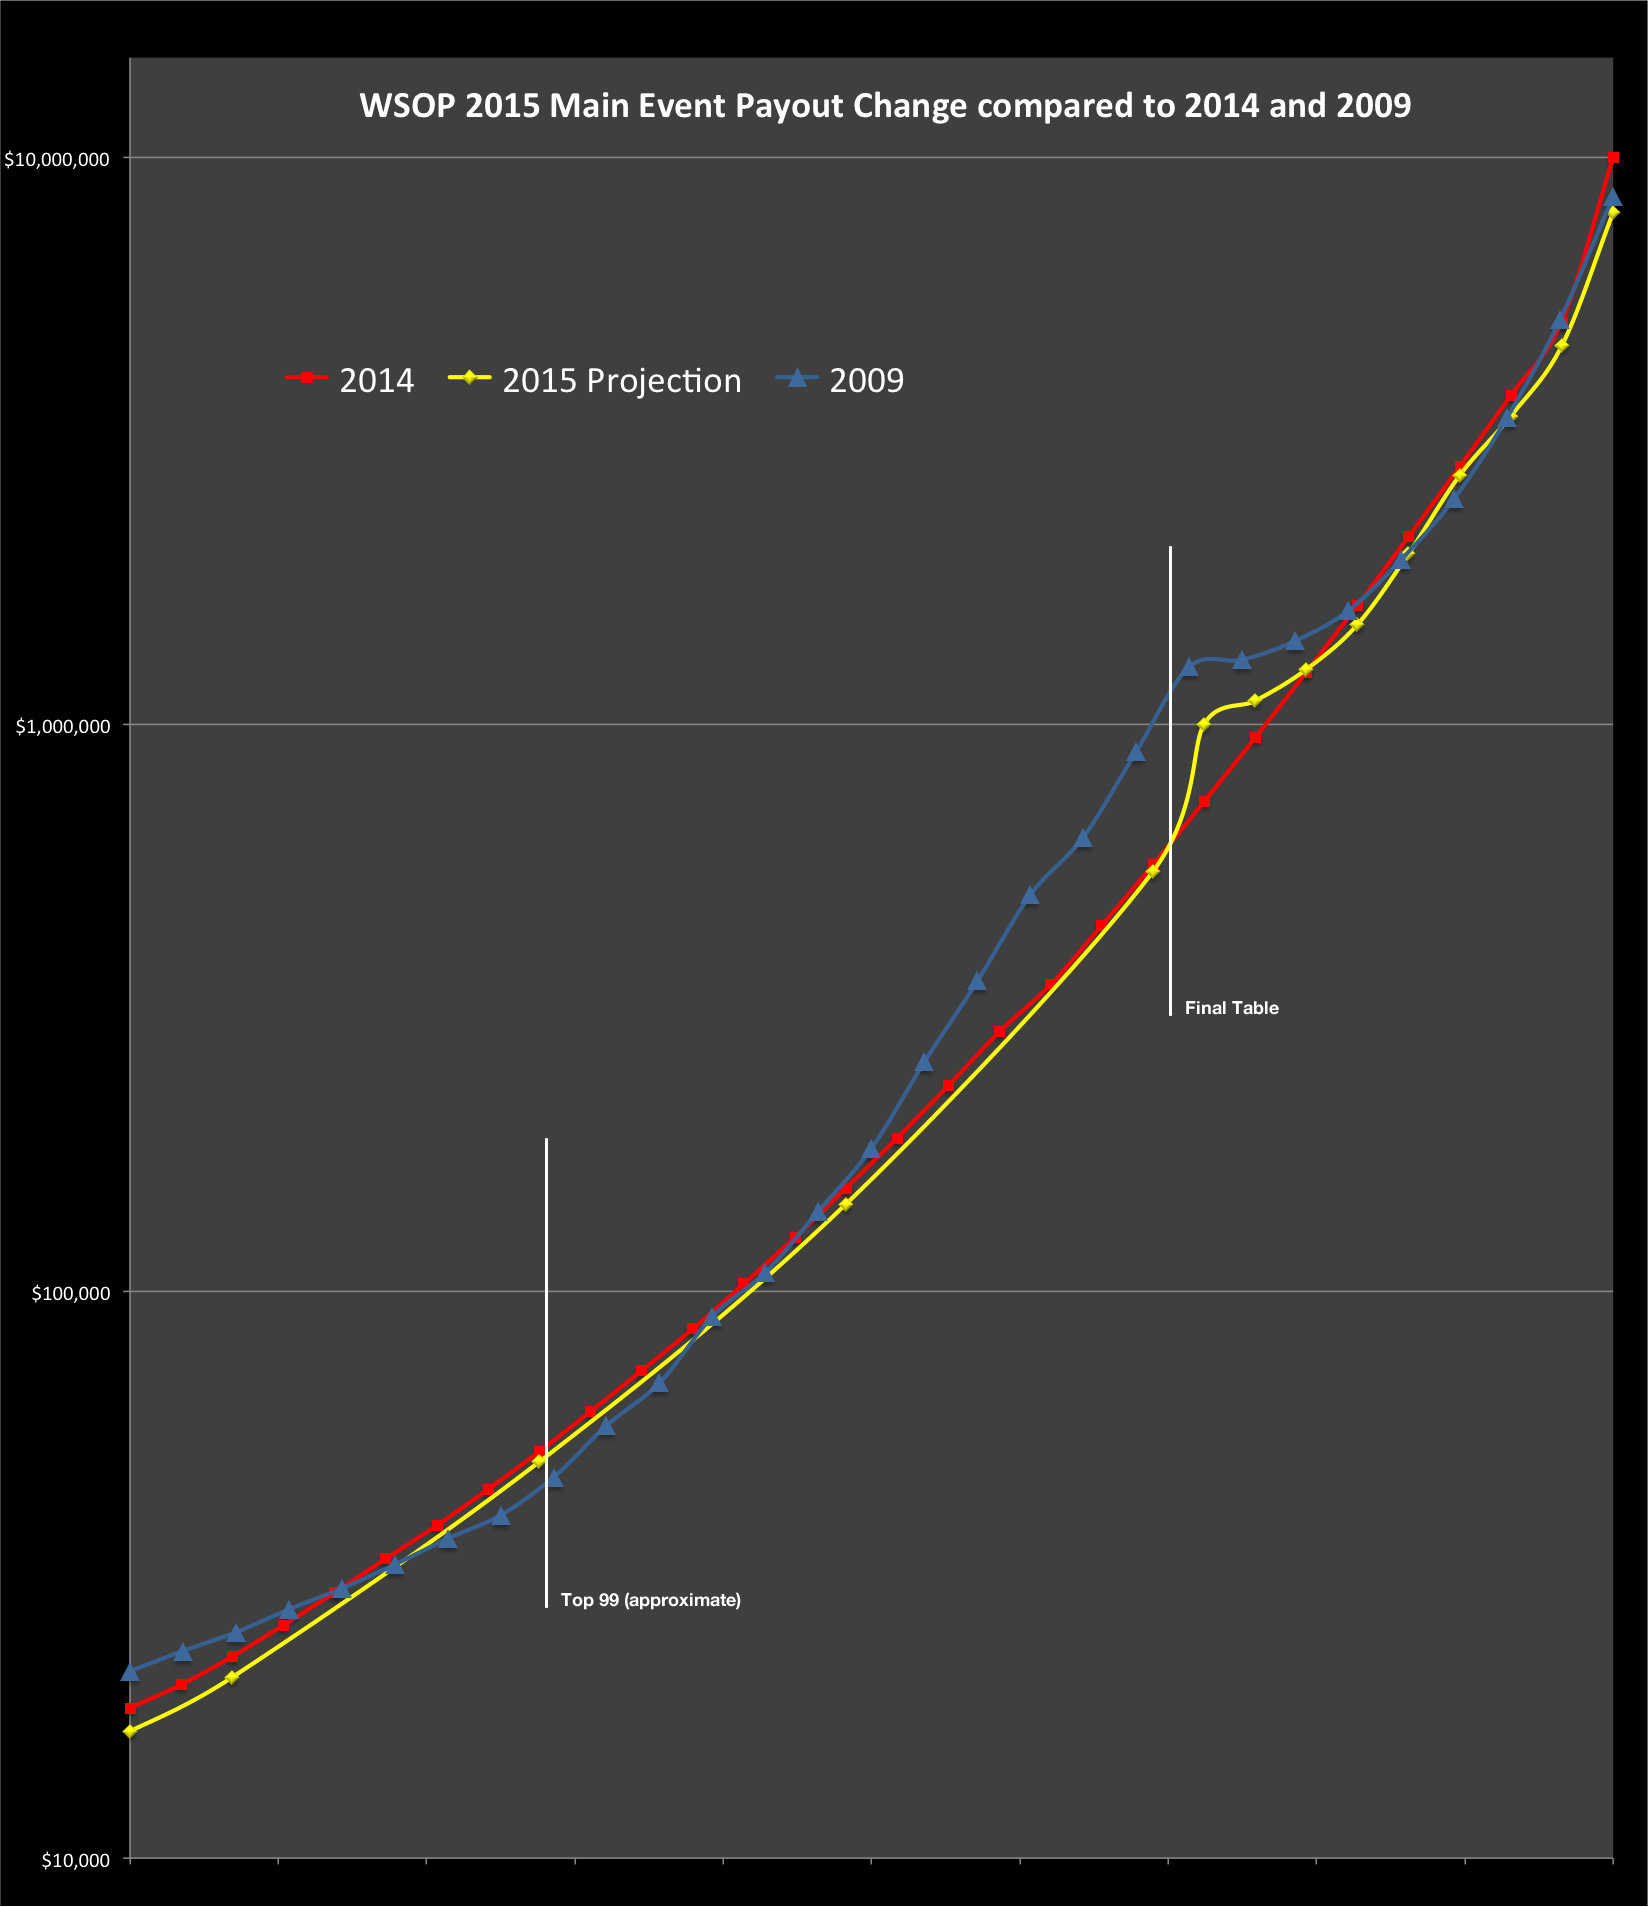
Aside from the obvious advantage for about 5% of the field getting half their buy-in back instead of nothing, the big changes are for the last couple of November Niners, who could see more than a third-again as much money than they would have in 2014. Those bonuses comes at the obvious expense of the player on the top (hopefully, you didn’t go and spend your $10M guarantee payday anywhere yet) and the players at the bottom of the structure (payouts 37-693), who are losing less in absolute dollar value but a larger percentage of their cash, than players higher in the structure, for the most part. Once again, here is the projected 2015 payout curve, compared to 2014 and 2009. It is less funky than 2009.